Big data shows how what we buy affects endangered species
We don’t have to snuff out species when we eat a hamburger or buy a tee-shirt— if we know how our consumption affects endangered and threatened species.
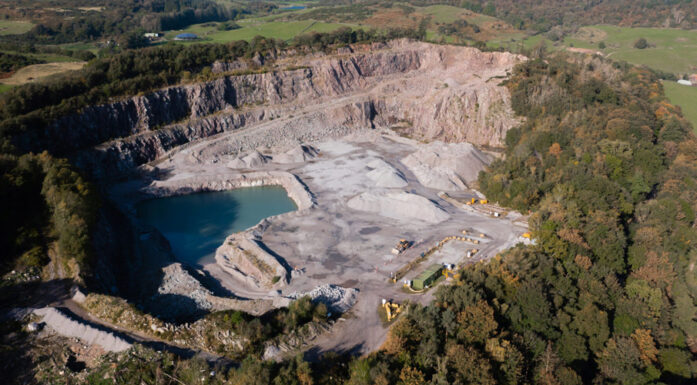
The things we consume, from iPhones to cars to IKEA furniture, have costs that go well beyond their purchase price.
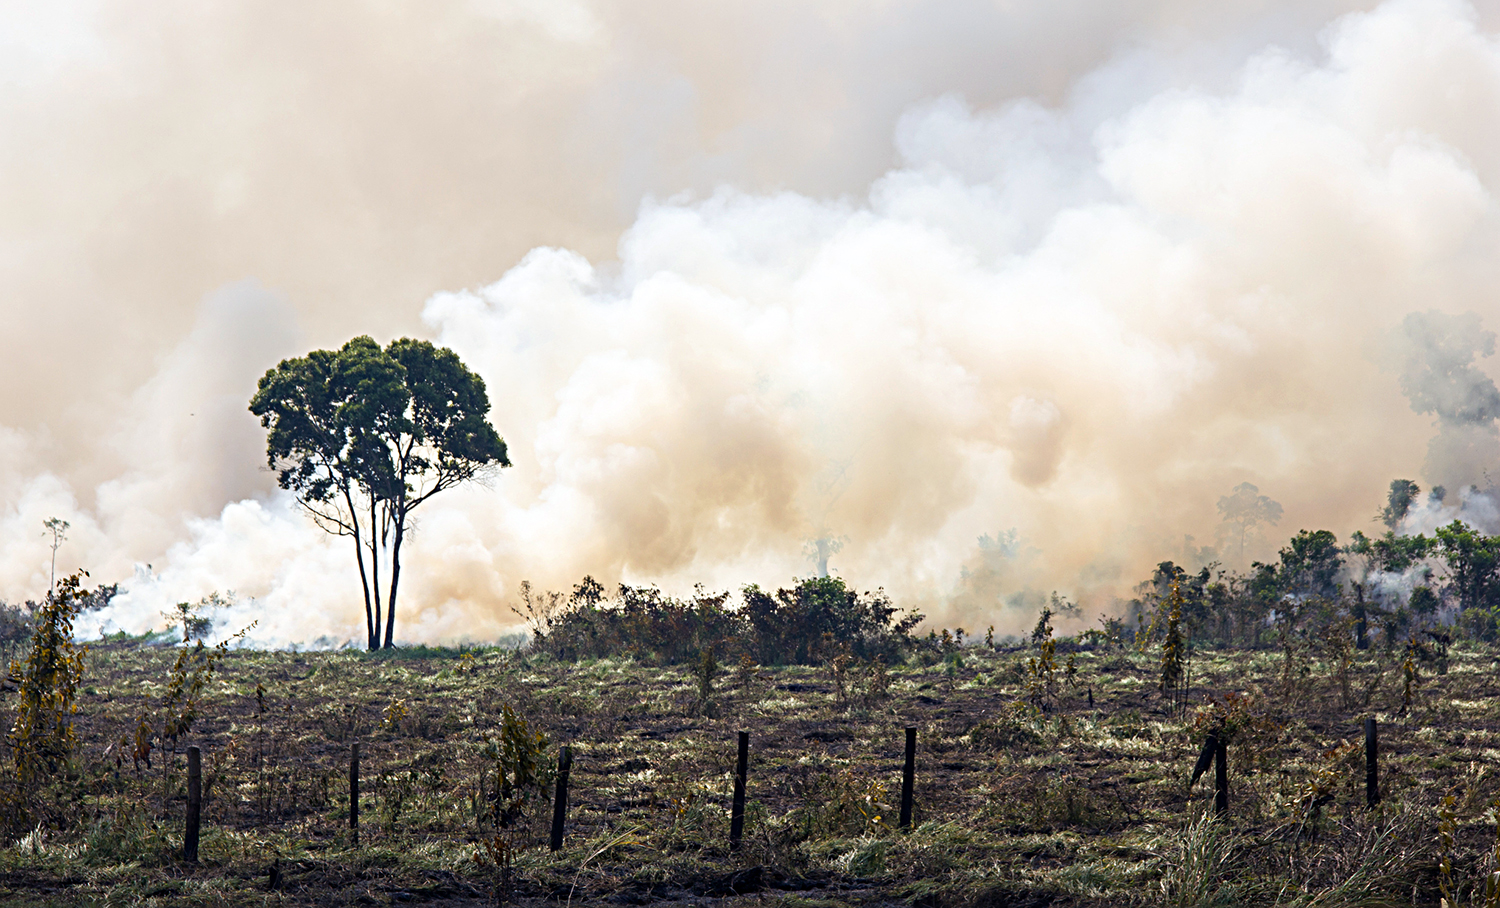
What if the soybeans used to make that tofu you ate last night were grown in fields that were hewn out of tropical rainforests? Or if that tee-shirt you bought came from an industrial area that had been carved out of high-value habitat in Malaysia?
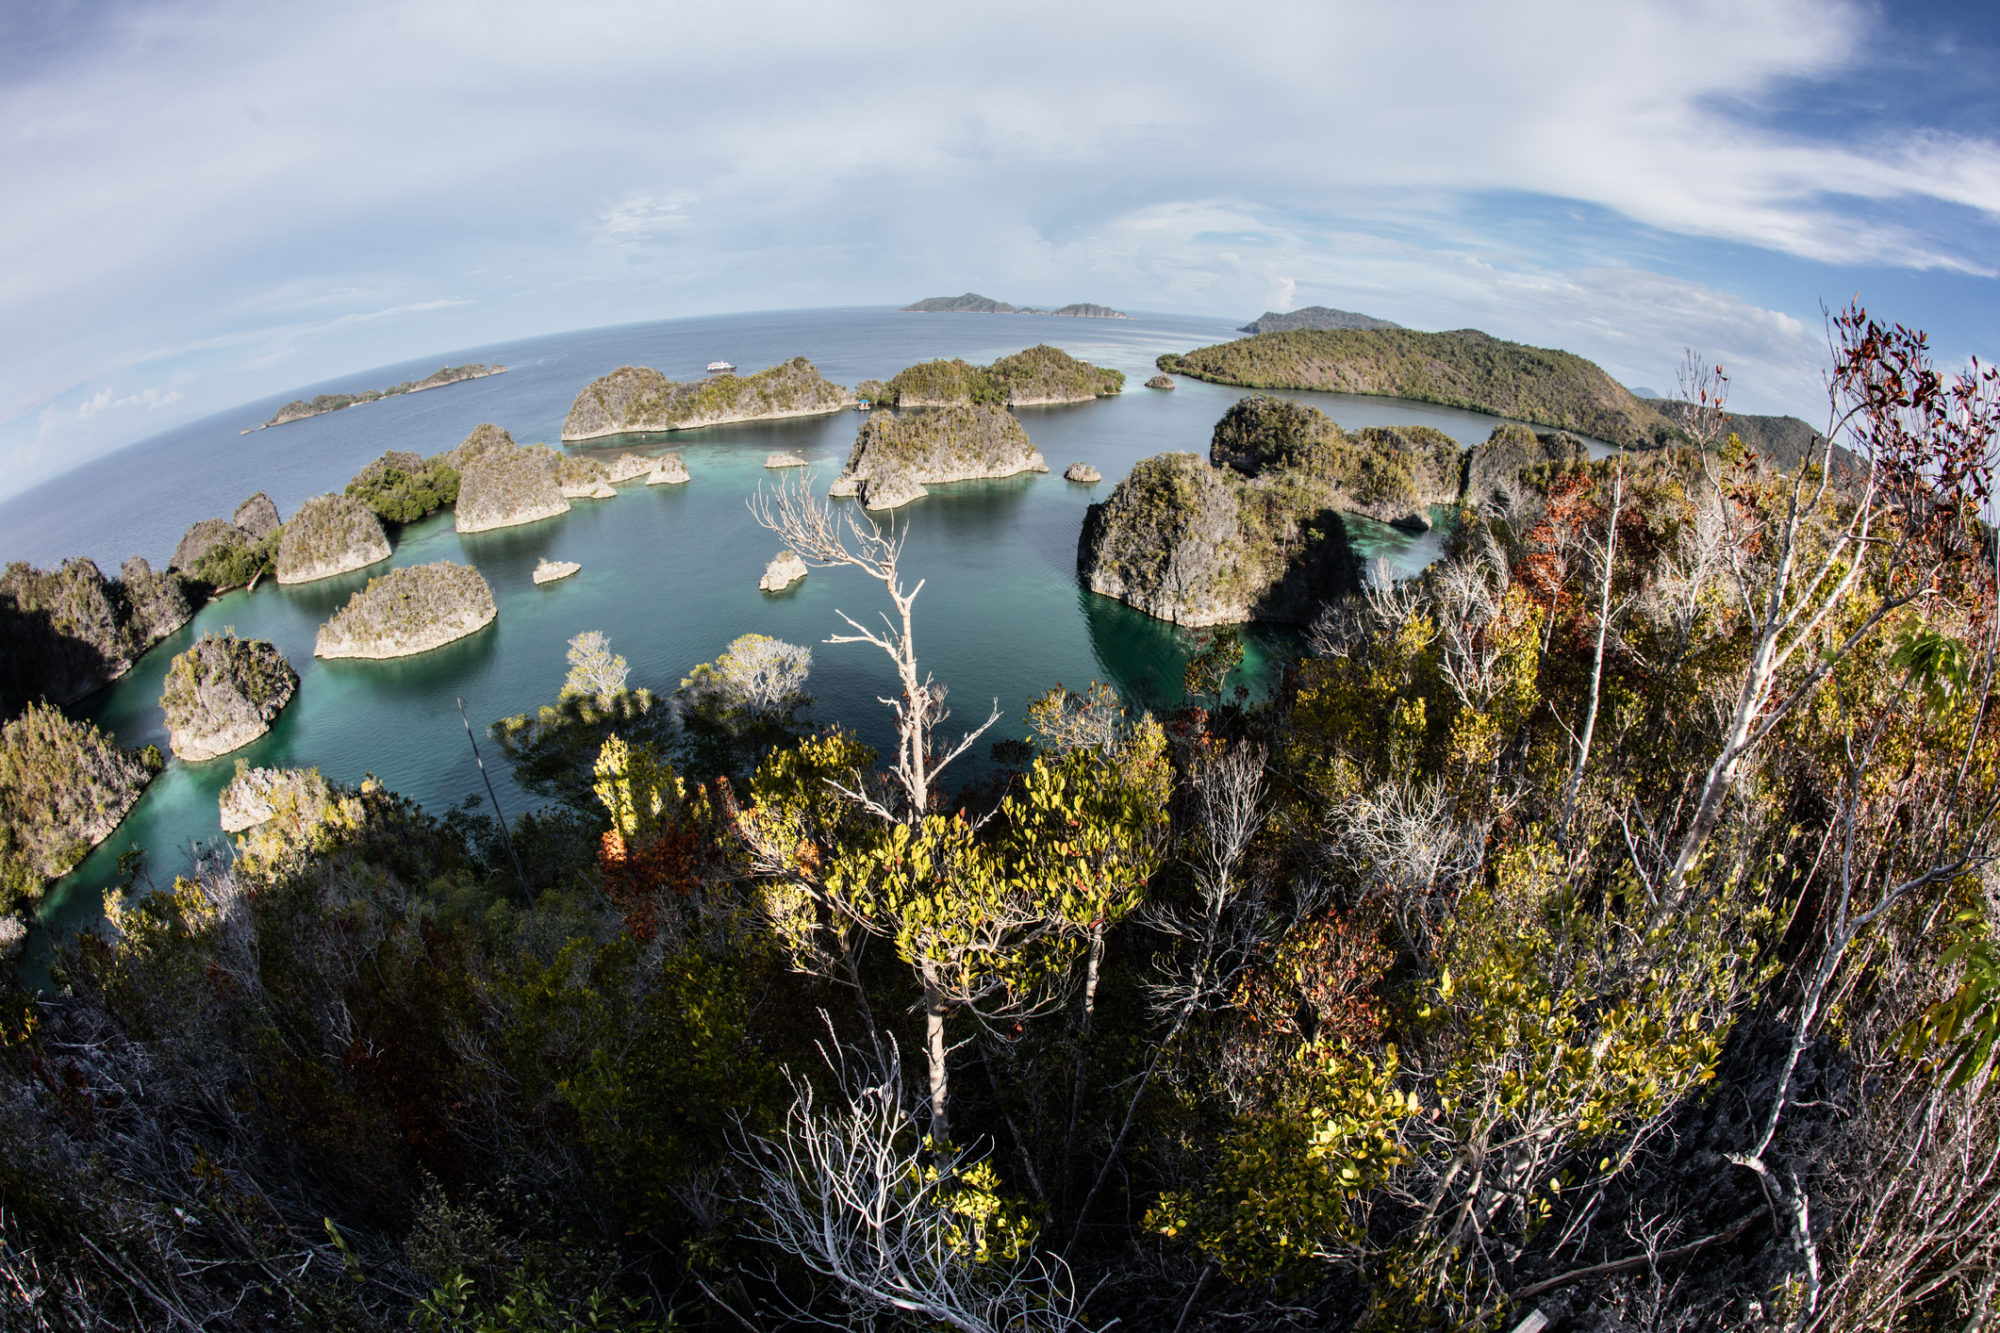
The remote limestone islands in Raja Ampat, Indonesia, are covered by vegetation. The islands are ancient, uplifted reefs, now surrounded by an array of vibrant marine biodiversity. But highly diverse areas in Indonesia can be threatened by development pressures driven by consumer purchases. Photo: Thinkstock
Unless you buy sustainably sourced food or goods, however, it can be hard to know just how consumer purchases affect species — until now. Daniel Moran from the Norwegian University of Science and Technology and his colleague Keiichiro Kanemoto from Shinshu University in Japan have developed a technique that allows them to identify threats to wildlife caused by the global supply chains that fuel our consumption. They’ve used this technique to create a series of world maps that show the species threat hotspots across the globe for individual countries.
Once you connect the environmental impact to a supply chain, then many people along the supply chain, not only producers, can participate in cleaning up that supply chain.
Their article describing this effort has been published online in Nature Ecology & Evolution this week.
6803 species considered
The researchers calculated the percentage of threat to a species in one country due to consumption of goods in another, with a focus on 6,803 species of vulnerable, endangered, or critically endangered marine and terrestrial animals as defined by the International Union for Conservation of Nature (IUCN) and BirdLife International.
One way to see how the hotspot maps work is to look at the effects of US consumption across the globe.
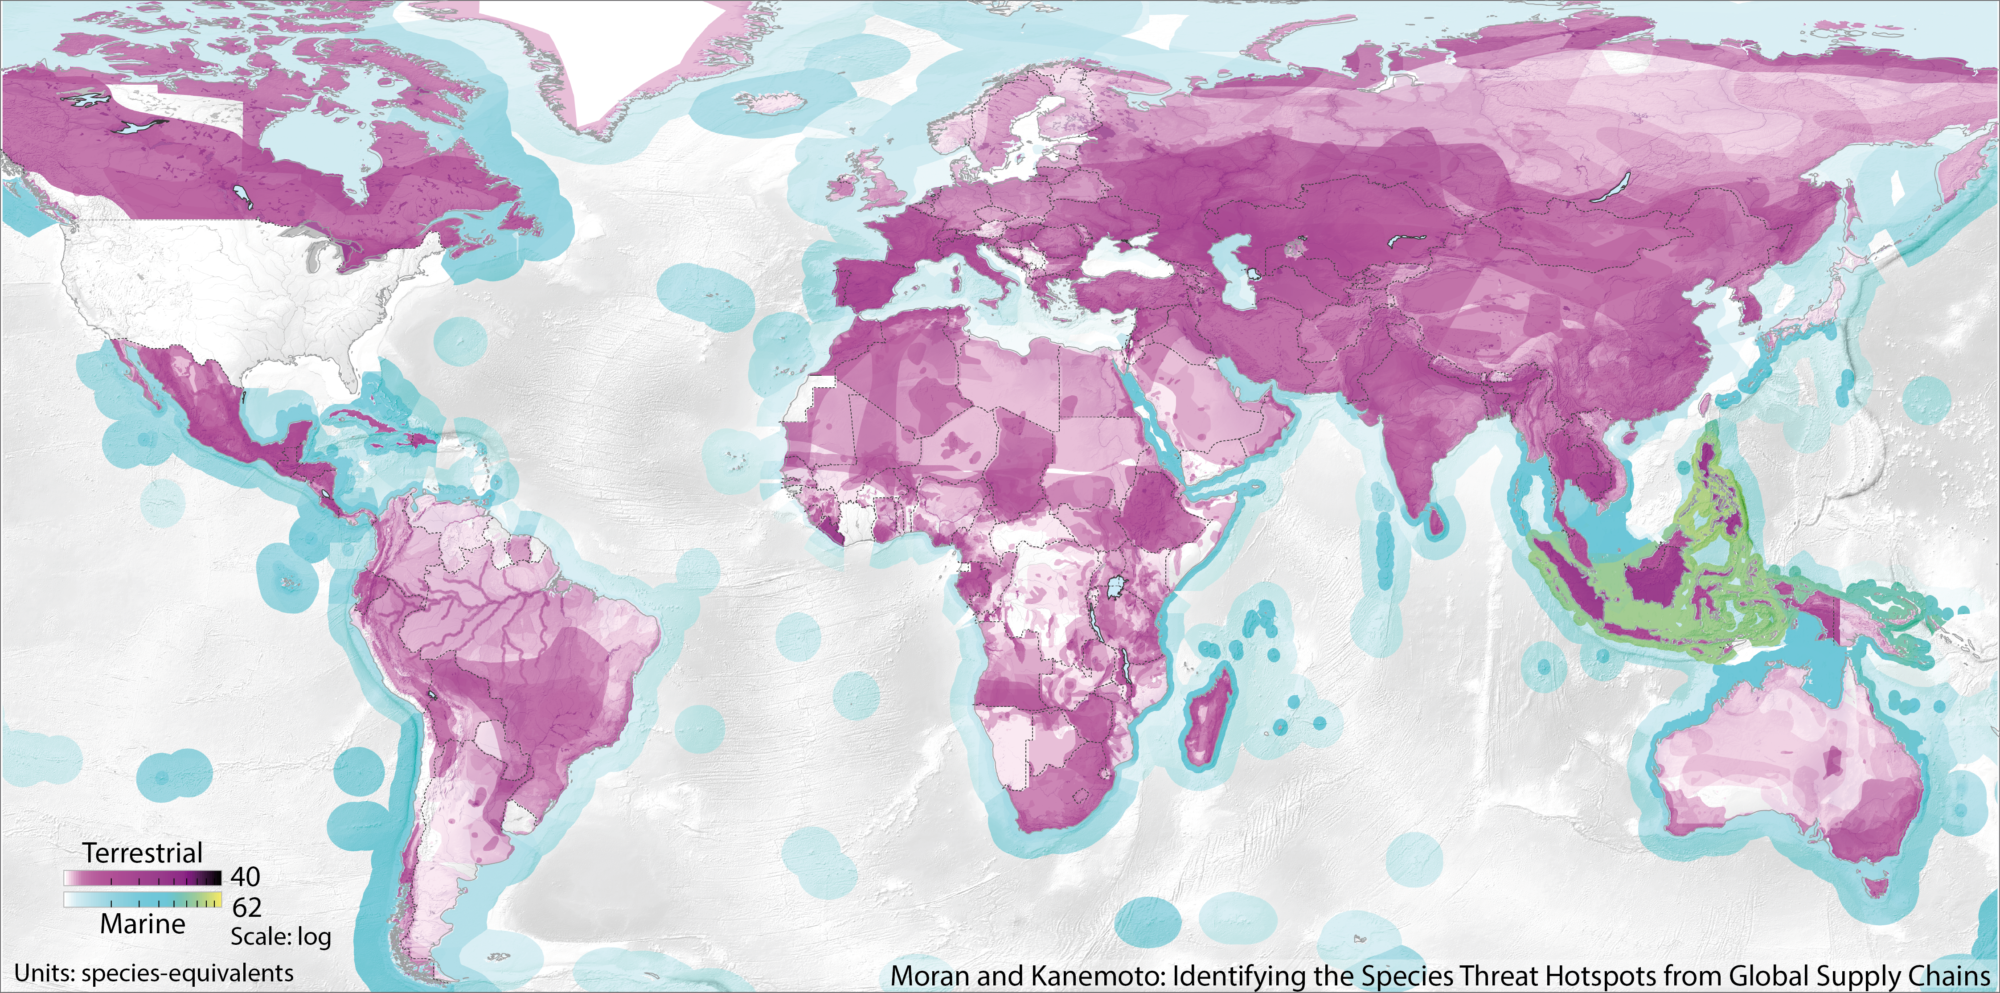
This map shows the species threat hotspots caused by US consumption. The darker the colour, the greater the threat caused by the consumption. The magenta colour represents terrestrial species, while the blue represents marine species. Map courtesy of Daniel Moran and Keiichiro Kanemoto.
For terrestrial species, the researchers found that US consumption caused species threat hotspots in Southeast Asia and Madagascar, but also in southern Europe, the Sahel, the east and west coasts of southern Mexico, throughout Central America and Central Asia and into southern Canada. Perhaps one of the biggest surprises was that US consumption also caused species threat hotspots in southern Spain and Portugal.
Connecting environmental problems to economic activity
Moran says making the connection between consumption and environmental impacts offers an important opportunity for governments, companies, and individuals to take an informed look at these impacts — so they can find ways to counteract them.
“Connecting observations of environmental problems to economic activity, that is the innovation here,” he said. “Once you connect the environmental impact to a supply chain, then many people along the supply chain, not only producers, can participate in cleaning up that supply chain.”
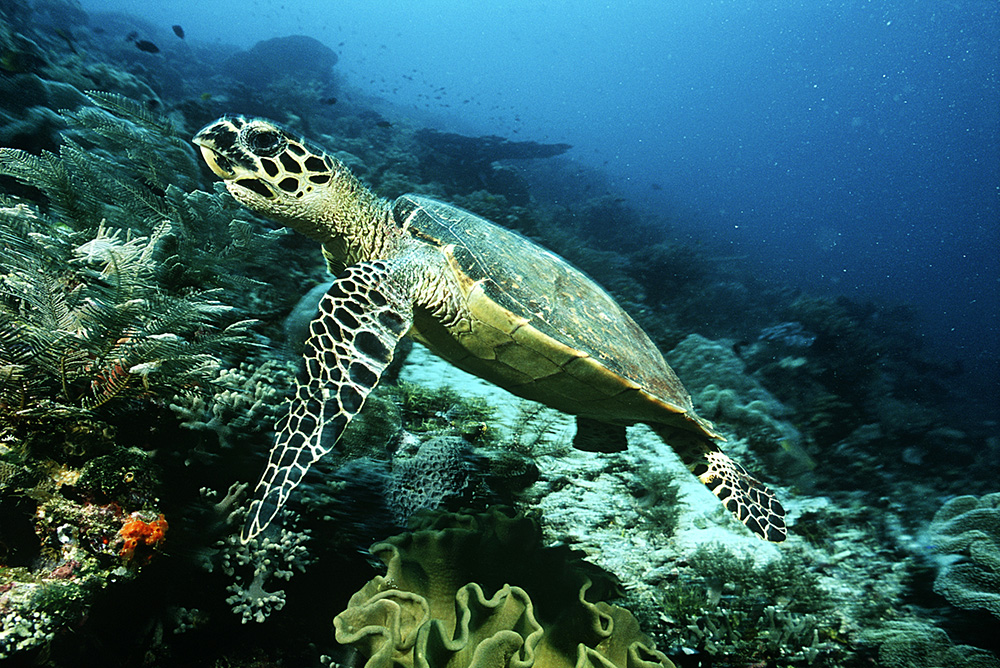
This hawksbill turtle (Eretmochelys imbricata), which lives in the coral reefs off of Indonesia, is critically endangered. Photo: Thinkstock
As an example, he said, government regulators can only control the producers whose products cause biodiversity losses and deforestation in Indonesia.
But if the EU wanted to look at its role in causing those problems in Indonesia, they could look at the maps produced by the researchers and see what kind of impacts EU consumers are having on that country, and where those impacts are located — the hotspots”.
The EU “could decide to adjust their research programmes or environmental priorities to focus on certain hotspots in Southeast Asia,” Moran said. “Companies could also use these maps to find out where their environmental impact hotspots are, and make changes.”
Reference: Daniel Moran and Keiichiro Kanemoto. Identifying species threat hotspots from global supply chains. Advance Online Publication 04 January 2017, Nature Ecology & Evolution. doi: 10.1038/s41559-016-0023