New study estimates the carbon footprints of 13,000 cities
Many see cities as the new front lines of the climate change fight. Identifying the mayors and city councils in cities with the biggest carbon footprints, and the most power to make big changes, could mobilize a wave of reinforcements.
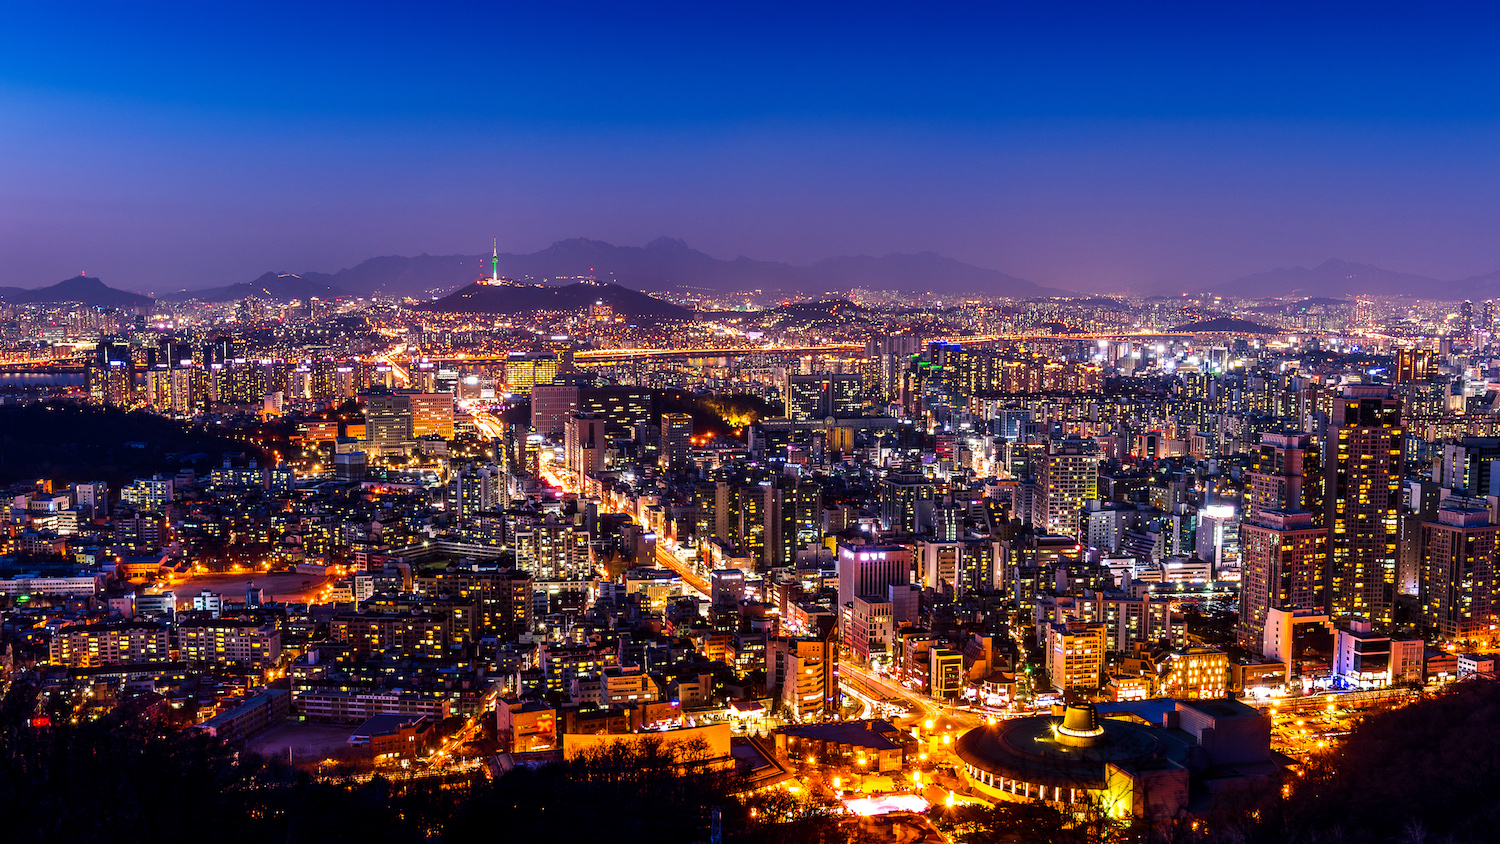
Cologne, Manchester, and Montreal rarely make the list of the world’s megacities. Yet they are all in the top 100 worldwide in terms of their carbon footprint. A new study says it is these cities, as much as the Jakartas and New Delhis of the world, that drive the global carbon footprint.
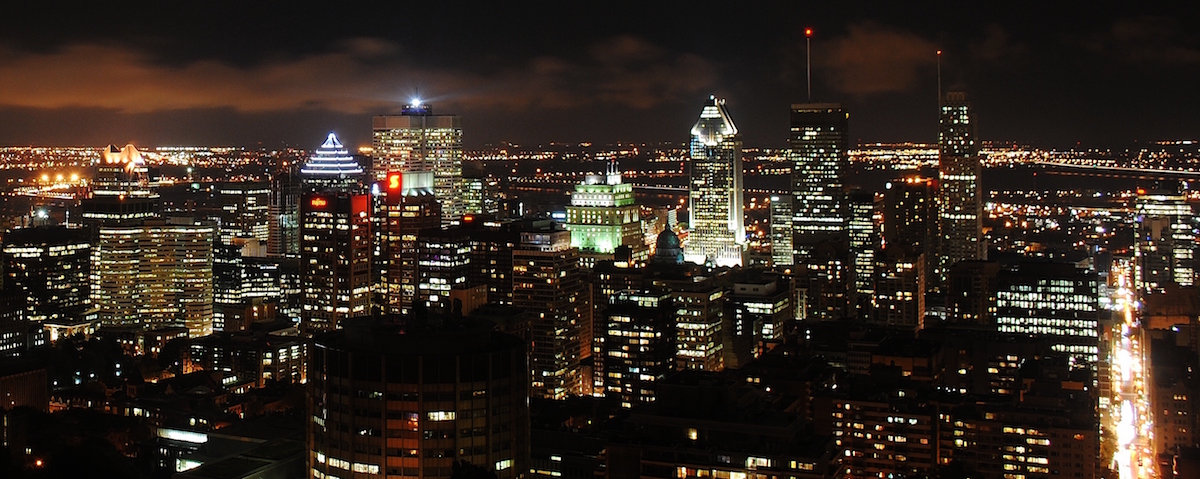
Montreal, with its 2.7 million people, isn’t really considered a megacity. But it ranks 83rd in the world when it comes to cities with the highest carbon footprints. Photo: Colourbox
Researchers from the Norwegian University of Science and Technology (NTNU) have surveyed the carbon footprints of 13,000 cities worldwide. This is the first time anyone has drawn a complete map of potential carbon footprint reductions from cities.
The paper’s lead author, Daniel Moran, says he was surprised at just how concentrated carbon footprints are.
“The top 100 highest-footprint cities worldwide drive roughly 20% of the global carbon footprint,” Moran said. “This means concerted action by a small number of local mayors and governments can significantly reduce national total carbon footprints.”
The results of their work have just been published in Environmental Research Letters. The researchers have also created a website so you can check the carbon footprint of your own city (if it is big enough).
- You might also like: Global hot spot maps link consumers with impacts
An urbanized world, getting more urban
Only about a third of the average individual’s carbon footprint is under their control (unless that person lives in a cave in the woods). The majority of our footprint is determined by the buildings we use, our daily commutes, and the energy we use – in other words, things directly under the influence of local governments.
Article continues under photo.

Not surprisingly, New York City, with its 13.6 million people, was number three on the list of cities with the largest carbon footprints. Photo: Colourbox
Urban areas are home to about 54% of total global population and account for more than 70% of global energy use, the researchers say. They’re also centres for concentrated economic growth: one estimate suggests that 60% of global GDP is generated by just 600 urban centres.
The researchers knew that economists have touted this enormous concentration of buying power as an opportunity to develop economic growth strategies focused on a few local governments.
If emissions footprints are similarly highly concentrated, they thought, then a relatively small number of local governments could have a disproportionate effect on reducing national, and thus global, emissions.
It turned out their hunch was correct.
How the model works
One of the key drivers behind the model is the by-now widely accepted paradigm that income is a strong predictor of carbon footprint.
If you think about it, it makes sense: the more disposable income you have, the more likely you are to purchase goods, or fly to a far-away country, or drive a fancy car. So they used income as a proxy for carbon footprint intensity. It’s not a perfect proxy – some of the world’s ultra-rich live in relative modesty – but as a general rule it’s shown to hold up.
They then used data from other published research to calculate and refine carbon footprint numbers at the national and subnational level.
Their global model makes use of existing carbon footprint estimates for 31,000 US ZIP codes plus state and province level results for the EU, UK, China, and Japan. They also used national statistics on the composition of urban versus rural spending patterns, regional purchasing power data from a private market intelligence firm, and a population map.
The result is a global model that predicts the purchasing power, population, and purchasing patterns for every grid cell worldwide.
Identifying cities was tricky, however. Many of what we call “cities” are in fact a collage of counties, boroughs, and suburbs.
For this study, the researchers took a shortcut: they used an off-the-shelf model from the EU that identifies urban areas as contiguous densely populated areas. This approach isn’t perfect – the EU model won’t be able to distinguish Brooklyn from Manhattan for example – but overall the researchers are confident in the results.
- You might also like: Household consumption significant driver of climate, other environmental impacts
From Dhaka to Fairfax County, Virginia
While many of the urban areas with the highest carbon footprints are in countries with high carbon footprints, 41 of the top 200 (such as Dhaka, Cairo, Lima) are in countries where total and per capita emissions are low (such as Bangladesh, Egypt, and Peru).
Here, Moran says, population and affluence in the urban areas combine to drive footprints at a similar scale as counterparts in the highest income countries.
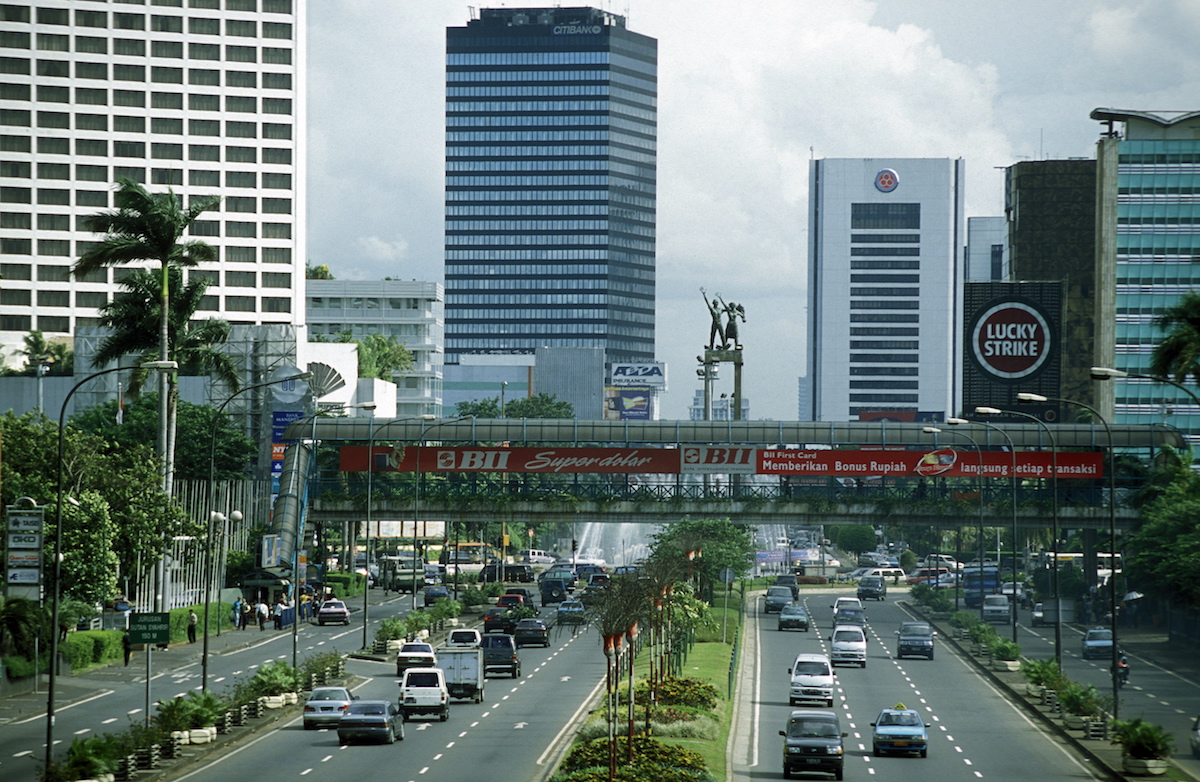
People don’t normally think of Indonesia as a country with a large carbon footprint. But Jakarta was number 19 on the list of the cities with the largest carbon footprints. Photo: Colourbox
“Downtown Dhaka is a bustling place. The decisions made there today lock in emissions, or sparing, for the next 50 years,” says Moran.
The researchers were also able to see the effect of wealthy enclaves, particularly in the US and in China, Moran said.
However, many of the cities with the highest footprints are also the richest, and thus have plenty of power to do something about it, Moran said.
“The fact that carbon footprints are highly concentrated in affluent cities means that targeted measures in a few places and by selected coalitions can have a large effect covering important consumption hotspots,” Moran said.
Mayors and citizens may also be willing to take more radical steps, such as switching the whole city over to green electricity, restricting private cars in the city center, or aggressively rewarding vehicle electrification, the researchers said.
Compared to countries, cities and local governments are often more nimble and can target the most effective solutions in different districts and demographic segments, Moran said.
REFERENCE: Daniel Moran et al. 2018 Environ. Res. Lett. in press https://doi.org/10.1088/1748-9326/aac72a
WEBSITE: https://citycarbonfootprints.info