Mapping the conflict between farming and biodiversity
A new study provides the most detailed dataset yet on the biodiversity footprint of food. The results can lead to more sustainable diets.
It’s well known that producing foods such as beef can have an outsized footprint when it comes to carbon emissions. But a new study shows that some of these same staples can have an equally huge effect when it comes to biodiversity losses.
One of the main problems, the study found, results when food production overlaps with areas that have been identified as having the highest conservation priority.
Food production remains the main cause of biodiversity loss.
“Food production remains the main cause of biodiversity loss,” said Keiichiro Kanemoto, an associate professor at the Research Institute for Humanity and Nature (RIHN) in Kyoto, Japan and one of the paper’s senior authors. “However, there is a painful lack of systematic data on which products and which countries contribute the most to this loss. Our research combines information about agricultural land use with species habitats to identify which crops cause the most pressure on biodiversity.”
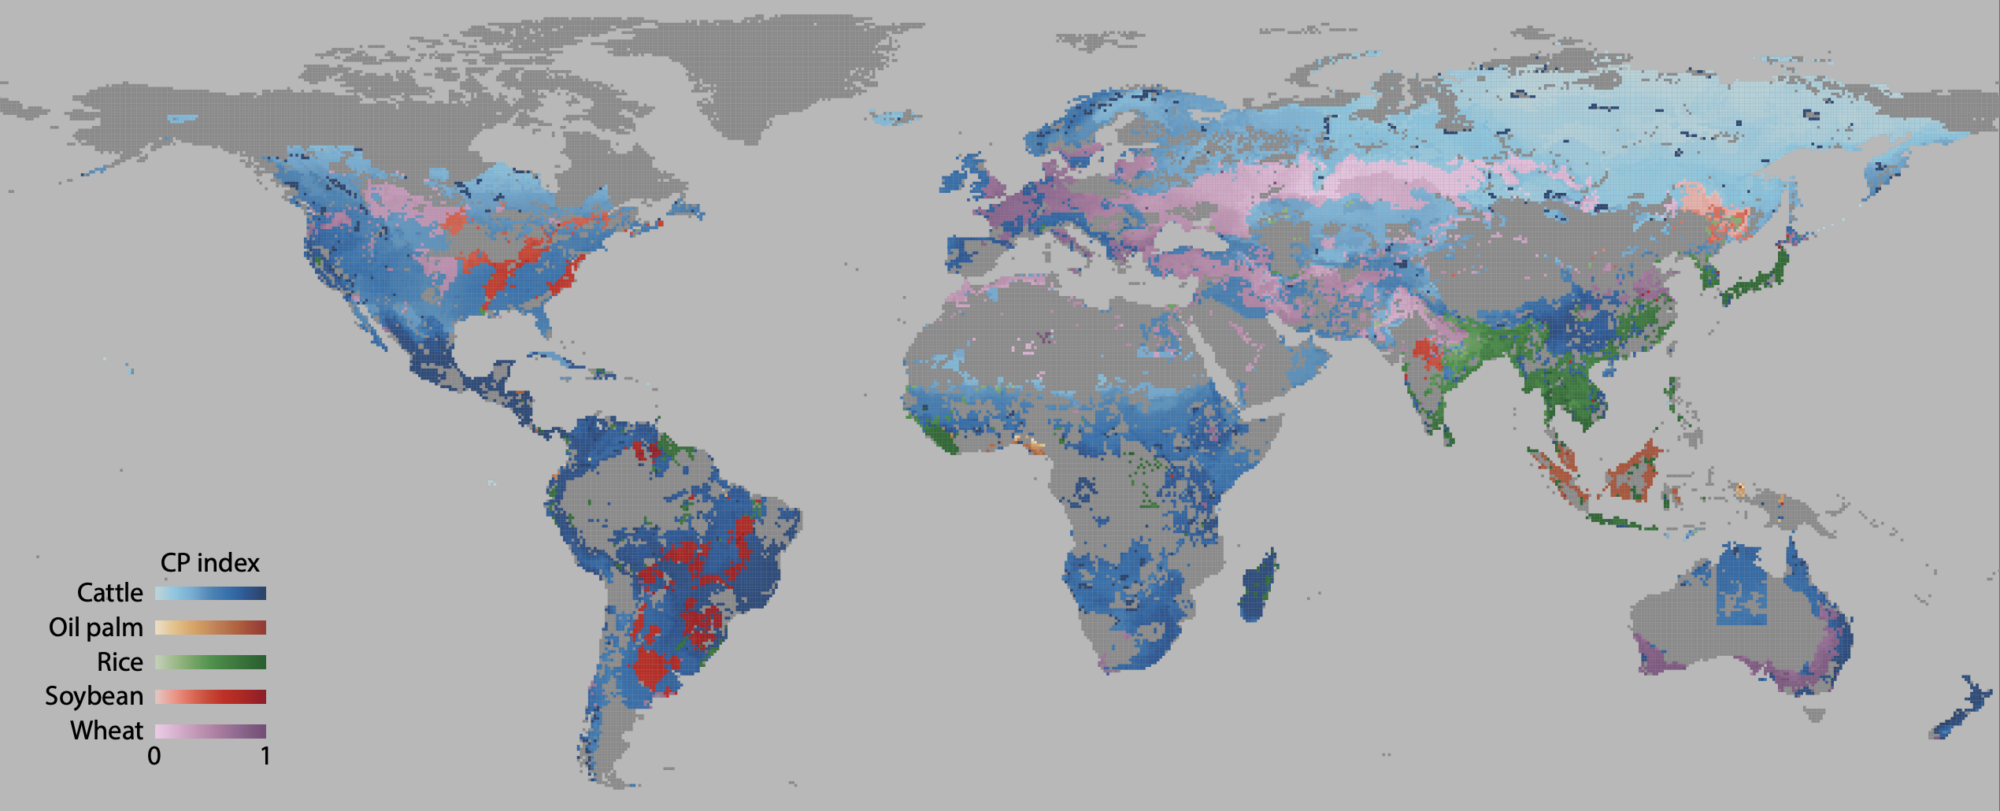
The map shows the land use and conservation priority index for major agricultural commodities. The grid cells are coloured according to the dominant crop grown, and the intensity of the colour, from lighter to darker shades, indicates the conservation priority of each cell. Graphic: Hoang et al. 2023.
The study, published in the Proceedings of the National Academies of Science, ranks which commodities are sourced from regions with high priority for conservation. While previous studies have quantified the carbon, land, and water footprints of the agriculture industry, the threats to biodiversity and ecosystems from farming are poorly understood and thus often omitted. The new results are expected to assist with the formation of policies that protect biodiversity while preserving global food security.
The results have been made publicly available on Google Earth Engine, a cloud computing platform used for environmental analyses. The study covers 50 agricultural products sourced from 200 countries, and draws on farming data, a database of global supply chains, and new ecological models with conservation data for more than 7000 species to estimate the conservation value of different areas.
- You might also like: World’s food production footprint on climate and the environment
Beef, rice and soy biggest footprint
The international research team, with members from Norway, the Netherlands and Japan, divided agricultural areas into four tiers, based on their conservation priority, from lowest to highest. They then determined which individual agricultural commodities were produced in these different priority levels.
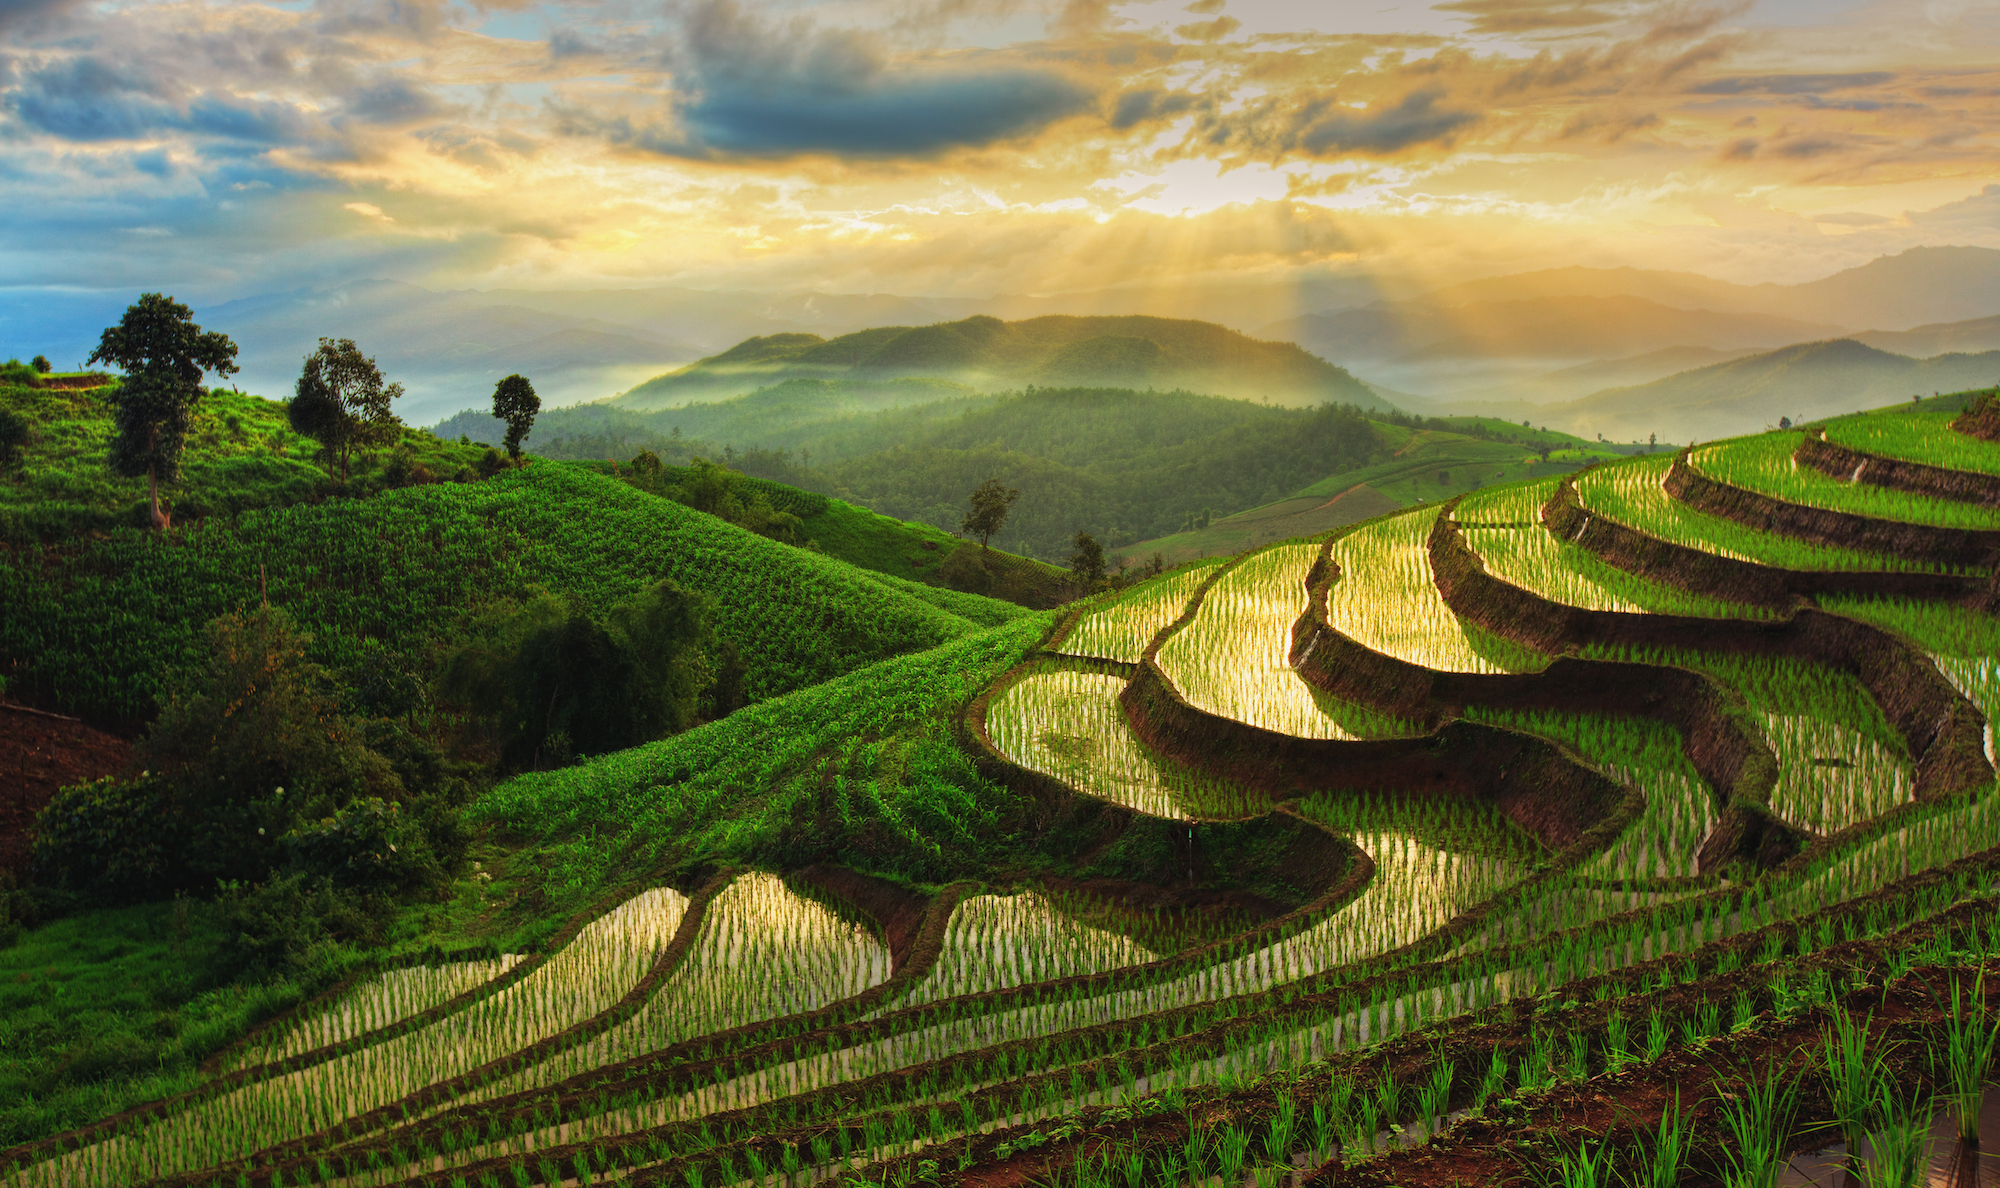
A terraced rice field in Chiangmai, Thailand. Chatrawee Wiratgasem / Shutterstock / NTB
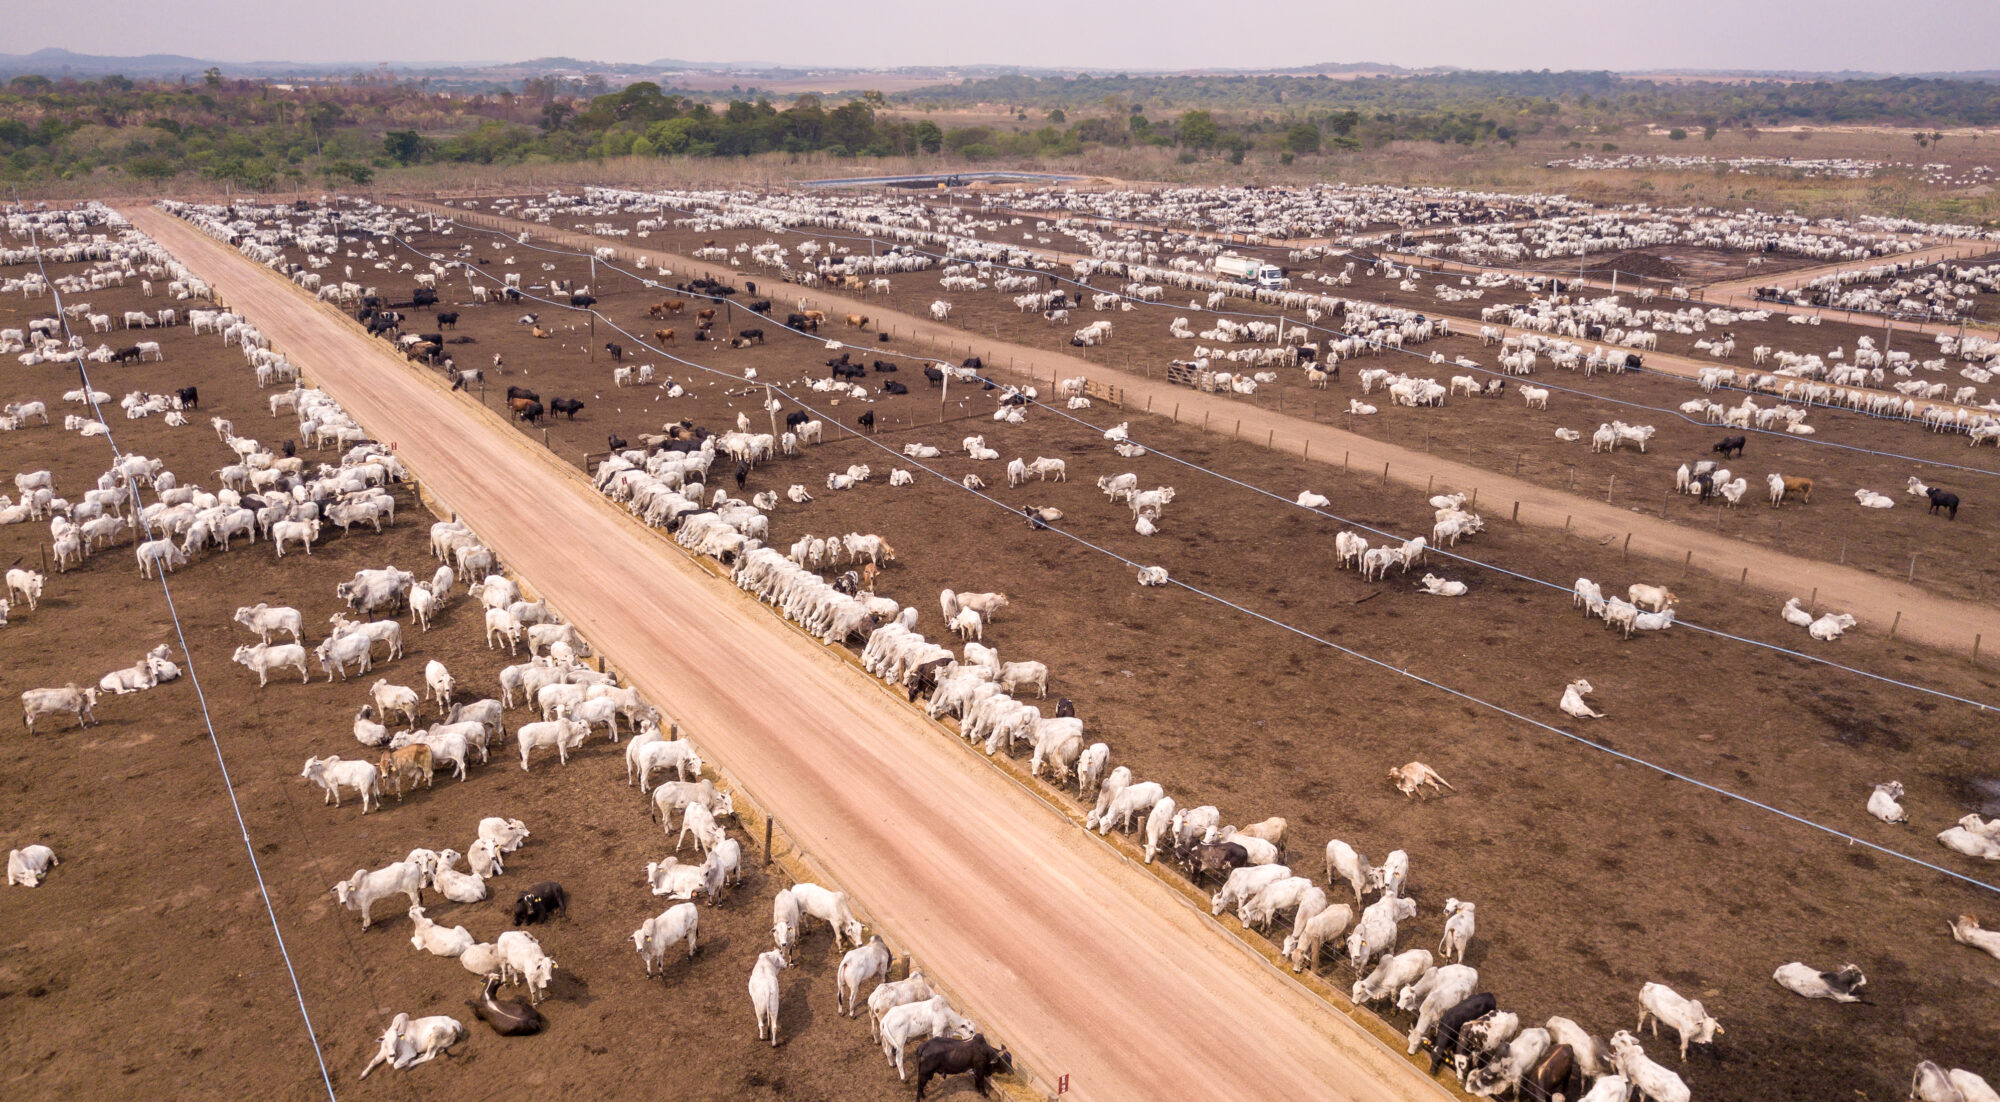
The researchers found that about one-third of all farming occurs in areas that were considered highest conservation priority. One pattern that emerged was that some staple commodities, such as beef, rice, and soybeans, tended to be produced in high conservation priority areas. At the same time, other substitutes, such as barley and wheat, were predominantly sourced from lower risk areas.
“A surprising takeaway for me was how much the impact of the same crop can vary based on where it is sourced from,” said Daniel Moran, a senior scientist at the Climate and Environmental Institute NILU and a research professor at NTNU’s Industrial Ecology Programme who was also a co-author of the study.
Beef and soybeans, for example, are grown in high conservation priority areas in Brazil but not in North America. Similarly, wheat is grown in lower conservation priority areas in Eastern Europe than in Western Europe.
- You might also like: People over 6o are greenhouse gas emission bad guys
International trade a factor
Coffee and cocoa are primarily grown in high conservation priority areas in equatorial nations, but these cash crops are largely consumed in richer nations like the United States and members of the European Union, the researchers’ model showed. At the global level, China, with its high demand for multiple commodities, has the biggest influence on food production in high priority conservation areas.
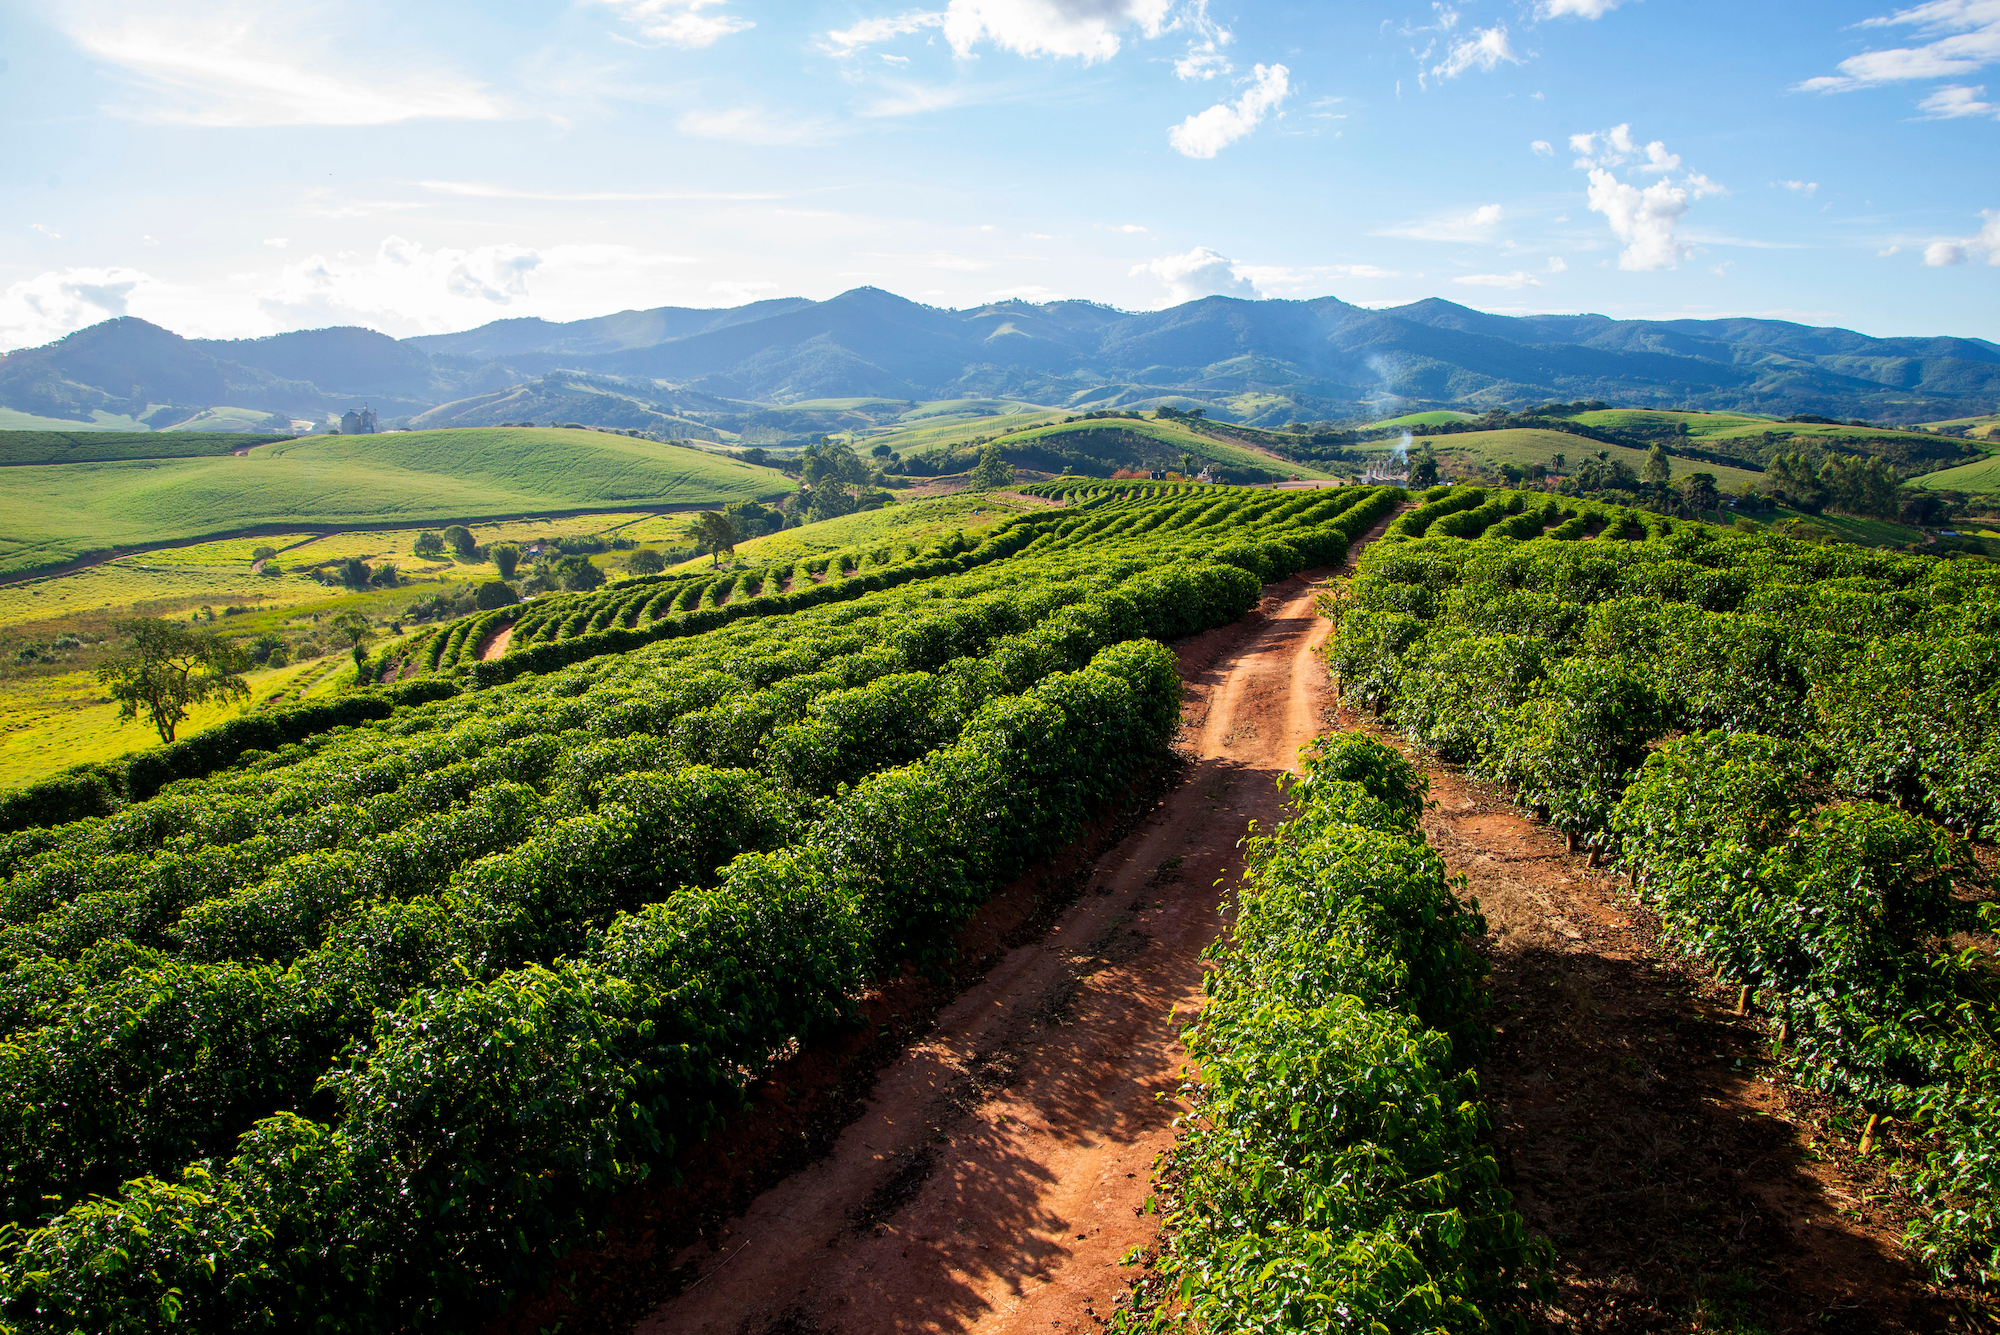
Arabica coffee plantations in Minas Gerais, Brazil. Monocropping — when a single type of crop is planted for production purposes — eliminates whatever biodiversity was previously found in that location. Minas Gerais is south of the Amazon rainforest. Photo: Luciana Tancredo / Shutterstock / NTB
The study also illustrated how different nations can have sharply different biodiversity food footprints. The United States, EU, China, and Japan all depend heavily on imports to satisfy their demand for beef and dairy. In Japan, more than one-quarter of the beef and dairy consumed in that country comes from high conservation priority areas. For the other regions, that number is closer to just ten per cent.
“That suggests there are opportunities to change the biodiversity footprint of food consumption by simply changing our sourcing of food products” said Kanemoto.
While it’s well known that cattle, soybean, and palm oil are farmed in high conservation priority areas, the study found that other commodities, including corn, sugarcane, and rubber, are also problematic and deserve more attention from policymakers.
- You might also like: Household consumption significant driver of climate, other environmental impacts
Effects of climate change
The changing climate is expected to alter both cropping patterns and available habitats. The research team used their model to look at different scenarios to see how the interaction between wild biodiversity and farming would change under predicted 2070 temperatures.
Species are likely to colonize new territories in a warmer world, which could result in the emergence of new high conservation priority areas or mitigate conflicts in current conservation hotspots.
While the researchers did not produce a detailed map forecasting future conflicts between agriculture and conservation, the paper’s supporting information offers some estimates of future competition under a range of scenarios.
“Our spatial approach is a valuable complementary method with other standard techniques to evaluate the impact agriculture has on biodiversity. The knowledge gained from our study should help reduce the trade-off many nations associate with agriculture production and environmental protection,” said Kanemoto. “It fills in a big missing piece in the footprint of food.”
“Our lifestyles are causing alarming damage to the atmosphere and water supplies. Farmers and governments worldwide are seeking policies that sustain prosperity while minimizing irreversible harm to the environment. Similar sustainable development policies are needed for agriculture. The calculation of detailed footprints for food and other farmed commodities is crucial to support these policies,” Moran said.
The results can be viewed in an interactive map at https://agriculture.spatialfootprint.com/biodiversity
Watch a video that summarizes the article:
Reference: Nguyen Tien Hoang ,Oliver Taherzadeh, Haruka Ohashi, Yusuke Yonekurada, Shota Nishijima, Masaki Yamabe, Tetsuya Matsui , Hiroyuki Matsuda, Daniel Moran and Keiichiro Kanemoto. Mapping potential conflicts between global agriculture and terrestrial conservation. Proceedings of the National Academies of Science Vol. 120, 2023. https://doi.org/10.1073/pnas.2208376120