Help for fishing vessels to locate their catch
Big Data means that professional fishermen will soon be getting their own decision-making tool. It will tell them where fish shoals are located, and how their vessels can be operated as economically as possible.
Currently, fishermen set out for sea armed with a log book, their experience and intuition. But sometimes this isn’t enough and they return empty-handed. For some time now fishermen have wanted to obtain data that can help them better predict where fish can be found.
Facts:
ESUSHI (2015-2018) is a so-called IPN project (R&D based on private sector strategies), integrated as part of the Research Council of Norway's MAROFF programme.
The project partners are: SINTEF, Nordnes AS (Project Owner), Havfisk ASA, Dualog Fisknet AS and Furuno Norge.
Master's and Ph.D. students from both NTNU and Tromsø are participating in the research work.
And success may be just around the corner. Vessel owners Nordnes AS and Havfisk ASA have been in the forefront of work linked to the project called ESUSHI, carried out together with researchers from SINTEF. Fishing vessels, the supply industry, the Norwegian Meteorological Institute (NMI) and the Nansen Environmental and Remote Sensing Centre in Bergen are now supplying massive amounts of the data they have acquired as a basis for a decision-making tool.
“This is big” says Tormund Grimstad at Nordnes AS. “It’s a great idea that’s about to become reality. Future generations simply won’t be able to afford to make as many mistakes as we do, but now I know that in a few years my sons will be able to harvest the oceans efficiently.
Maps, graphs and numbers
In a room at SINTEF Fisheries and Aquaculture at Brattøra in Trondheim, four researchers are concentrating on a screen in front of them displaying maps, colourful graphs and columns of numbers.
Peter Halland Haro points to the screen and explains: “At the very top is a map showing hauls (net catches) grouped into small squares. Each square represents at least one haul, while the colour code indicates the catch for all the hauls in a given area. If I click on one of the squares I can view details pertaining exclusively to that area. All the graphs and information at the bottom of the screen will be updated to display only data relevant to the square in question”, he says.
Project Manager Ståle Walderhaug says that during the first phase, the researchers have constructed an interactive map where it is possible to search for different fishing grounds and obtain data on the numbers of fish caught there in the course of recent months. At the same time information is displayed about catches, dates, fish species, sea temperatures, salt concentrations, phases of the moon, a vessel’s energy consumption per haul, and so on. If the target is a specific fish species, we can just ignore the map and simply search for the species in question, such as North-east Atlantic cod, haddock or herring.
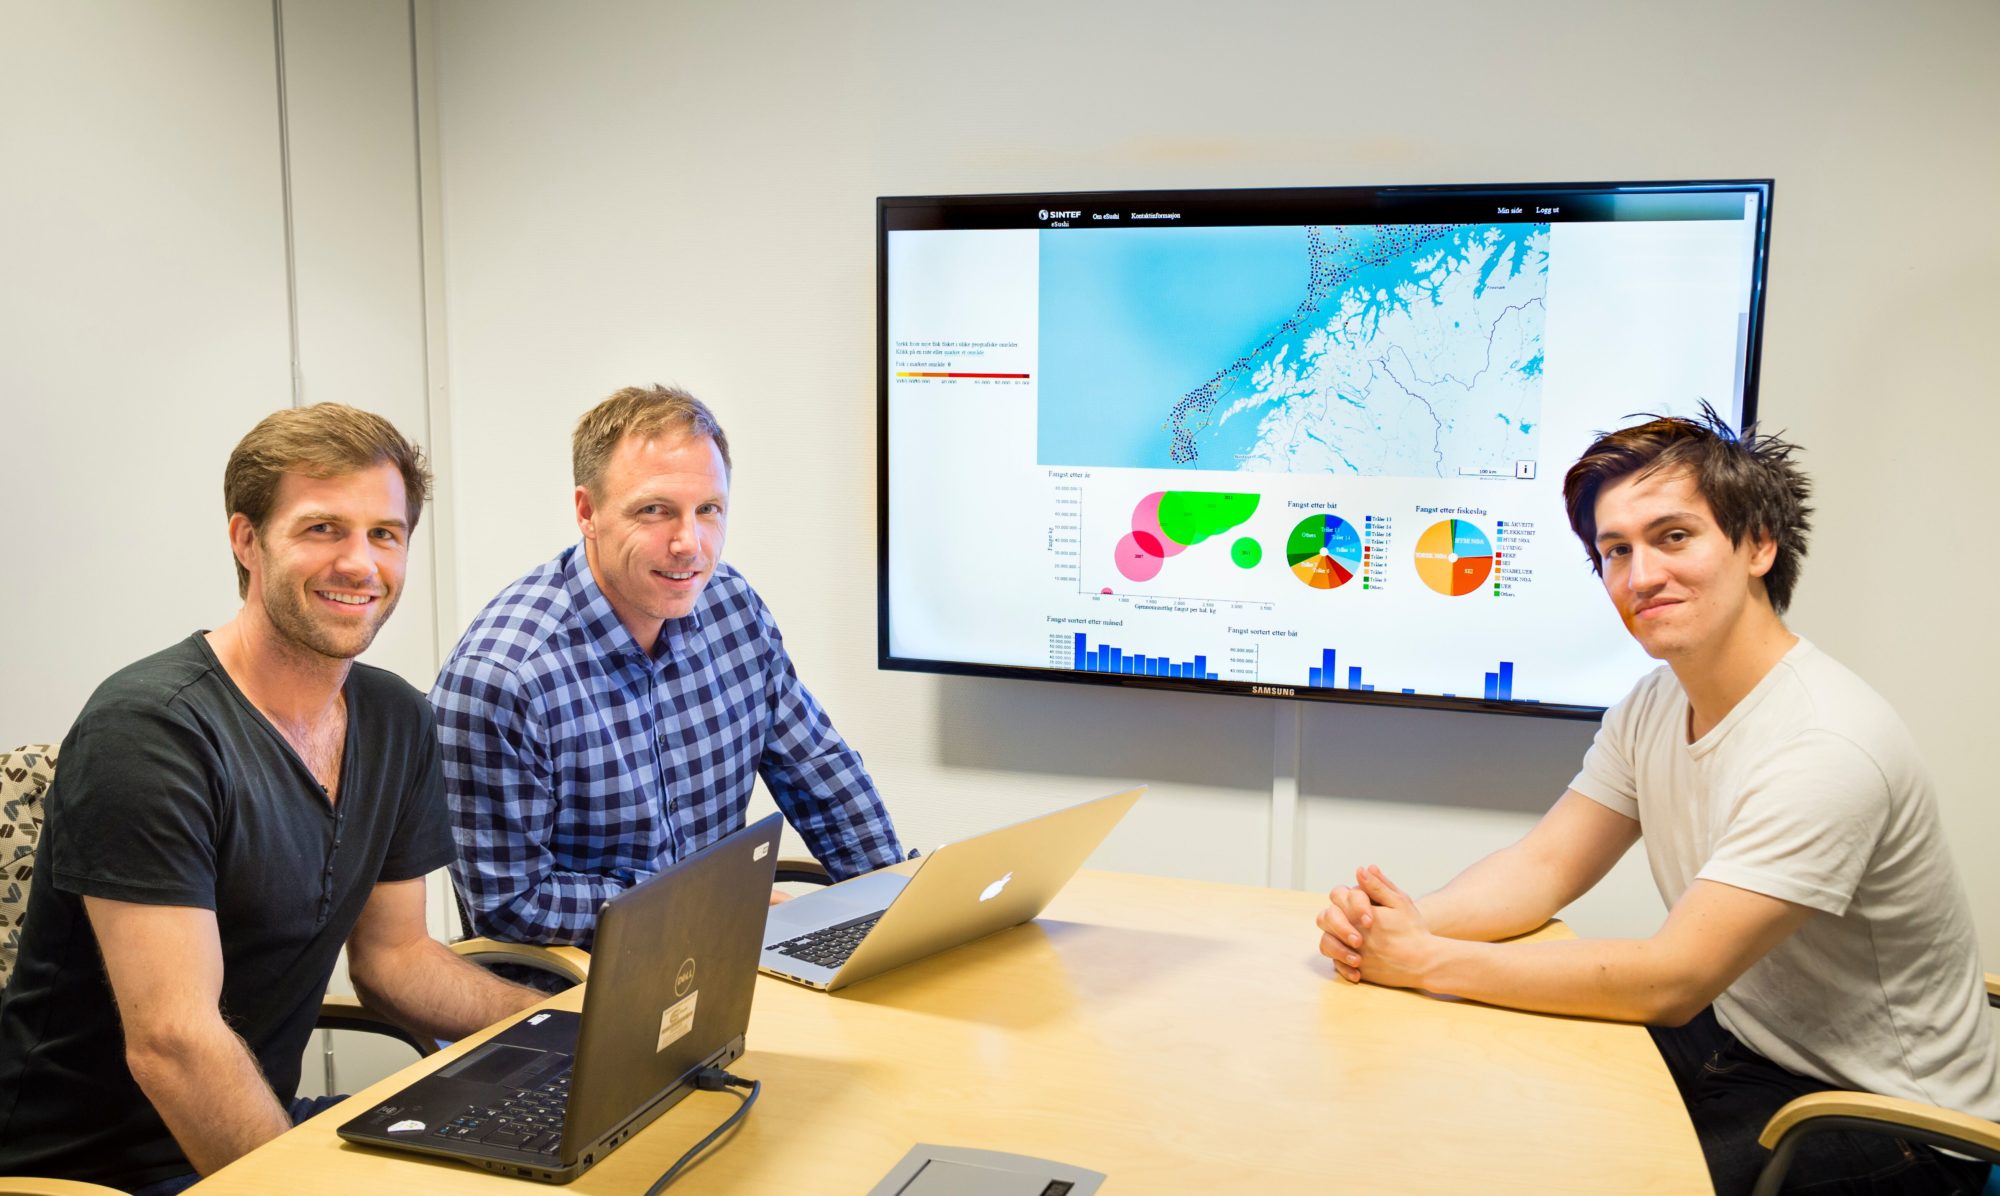
The SINTEF-researchers Ståle Walderhaug, Peter Haro and Jarle Ladstein are working with the screen displaying maps, colourful graphs and columns of numbers. Photo: Thor Nielsen.
Data acquisition
There has been a lot of willingness among both fishermen and the various organisations to share information, and many terabytes of data have now been gathered and systematically sorted. Vessel owners Nordnes AS and Havfisk ASA have provided catch data. The Nansen Centre has shared its data on marine chemical concentrations, and the NMI has contributed with information about sea temperatures, wind velocities, wave heights and salt concentrations.
The company Dualog AS in Tromsø is providing a system for electronic catch reporting that enables vessels to notify the public authorities of their catches on a daily basis. Moreover, a data centre has been constructed at SINTEF Fisheries and Aquaculture which has been gathering data supplied by 22 different fishing vessels since 2006.
Jarle Ladstein tells Gemini that the researchers have equipped the vessels with systems that enable them to supply several gigabytes of data on parameters such as engine performance and oil consumption. “Actually, there are some major differences when it comes to vessel fuel consumption”, he says, “and it’s important that the vessels operate efficiently out there on the fishing grounds”.
Predicting catches
The project partners believe that this innovation can develop into a simple and effective tool. Trawler fishermen have computer monitors in their vessels, and the idea is that in the near future they will be equipped with helpful displays of interactive maps and graphs.
“Our work now is not only about telling everyone what we’ve been doing in recent months, but also about predicting catches”, says Ståle Walderhaug. “Our aim will be to use advanced algorithms as a basis for recommending catch locations”, he says.
“This will be a reference standard for future generations”, says Tormund Grimstad at Nordnes. “We’re already seeing that numbers reported by fishermen don’t agree with the estimates made by fisheries researchers. There are far more fish in the sea than the estimates predict. Perhaps in a few years time it will be the fishing vessels that are supplying raw data to the researchers?” he says.