Keeping an eagle eye on carbon stored in the ocean
Geologic reservoirs that trapped petroleum for millions of years are now being repurposed to store the greenhouse gas carbon dioxide. New research is improving how we monitor this storage and verify how much CO₂ these reservoirs have stored.
As Norway and other nations begin to scale up the storage of CO2 in undersea geologic reservoirs, NTNU research is helping answer two important questions about this storage.
“Where has my CO2 gone? Is it leaking or not?” says Martin Landrø, an NTNU geophysicist and director of the university’s Centre for Geophysical Forecasting. “Those are the basic questions actually.”
This is like a revolution in visualization and understanding of what’s happening.
Norway is home to the longest running undersea CO2 storage project in the world, at the Sleipner gas field in the North Sea. There, a total of 20 million tons of CO2 have been injected at Sleipner into a saline aquifer called the Utsira Formation.
Using a data-analysis technique called full-waveform inversion, CGF researchers have taken a closer look at data from the Sleipner site. The data are collected using geophysical methods such as seismic imaging. (see box)
Full-waveform Inversion
Seismic imaging is used by geophysicists to look at undersea oil and gas reservoirs, as well as at carbon capture and storage sites. Seismic imaging can be thought of as a kind of ultrasound. But instead of scanning a human body, a ship sends sound pulses down into the seabed and records how the sound waves travel through the rock and reflect back to sensors at the surface.
In the past, researchers used only part of this information—mainly the arrival times of the sound waves—to build images of the subsurface. Full-waveform inversion makes use of the entire seismic signal, allowing scientists to extract much more detailed information about the structure and properties of the rocks under the ocean.
A new paper from a newly minted CGF PhD, Ricardo Jose Martinez Guzman, shows how effective this technique can be in verifying where CO2 is and how much has been injected.
“Maybe 10 years ago, the full-waveform inversion from Sleipner was like wearing very foggy glasses. But this has now advanced so far that we can see all the layers and all these feeders. So, this is like a revolution in visualization and understanding of what’s happening,” said Philip Ringrose, a professor in Energy Transition Geoscience at CGF.
This new video from NTNU’s Centre for Geophysical Forecasting describes in more detail how the centre is at the forefront of developing monitoring tools to image CO2 plumes underground to ensure that carbon capture and storage is performing as it should.
- You might also like: Wax, wood and CO2 – tools that can combat climate change
Where is my CO2? And is it leaking?
Right now, companies use ships to tow acoustic sensors over these undersea storage formations, sailing back and forth over the formation in a grid pattern, much like you might carefully mow a lawn.
We’re pushing the technology to show you can see everything with geophysics.
This takes time and money, of course. But could there be better ways to get the same information?
In areas where CO2 storage is land-based, companies can drill wells to check where the CO2 has gone, Ringrose said. But that’s not the best option in places like Norway, where storage sites can be a thousand metres or more below the seabed.
“Here we don’t use wells to check where the CO2 is. We only use geophysical data. That’s partly because we’re offshore, but it’s also because we’re pushing the technology to show you can see everything with geophysics,” Ringrose said.
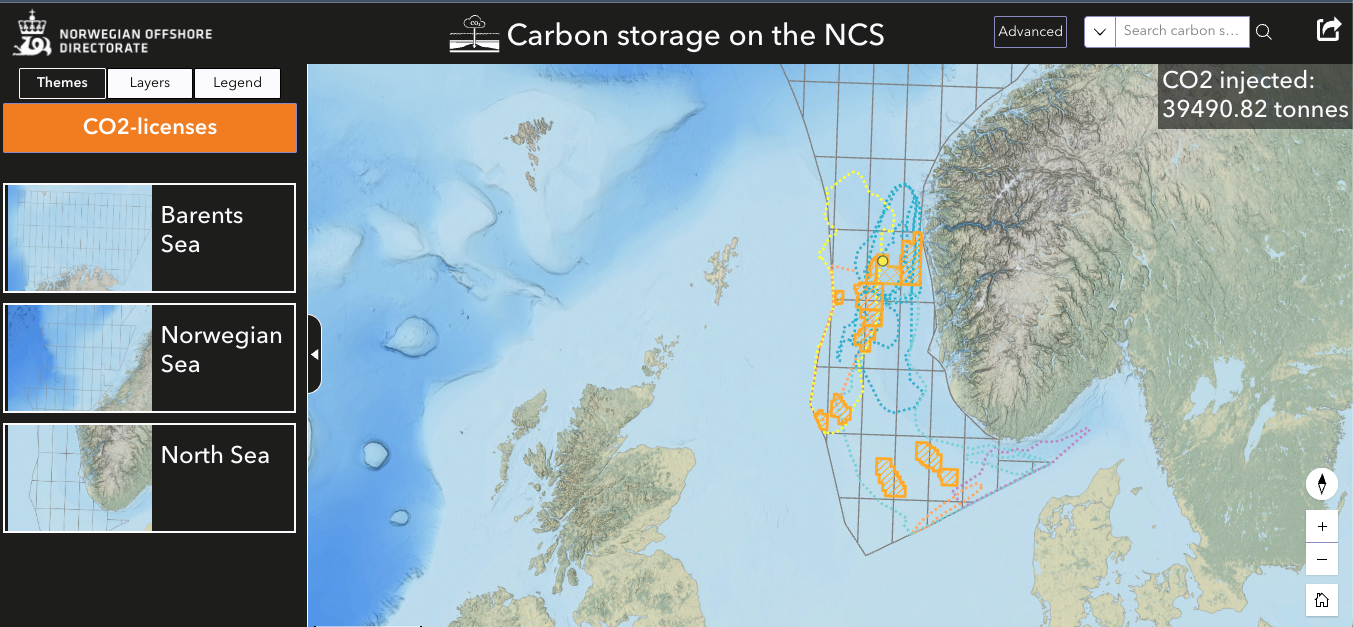
The Norwegian Offshore Directorate has an atlas that lists and assesses CO2 storage capacity on the Norwegian Continental Shelf (NCS). This screenshot shows an interactive map where undersea reservoirs have been explored (the orange hatched lines) and approved (the orange crosshatched lines). The areas outlined in blue or yellow are potential storage areas. At the date of this screenshot, roughly 39.5 thousand tonnes of CO2 had been stored on the NCS. Screenshot: Norwegian Offshore Directorate
A tank and a several-hundred-kilo plastic model
In addition to advancing analytical tools like Full Waveform Inversion, CGF researchers have built a new laboratory to help better understand the complexities of undersea storage.
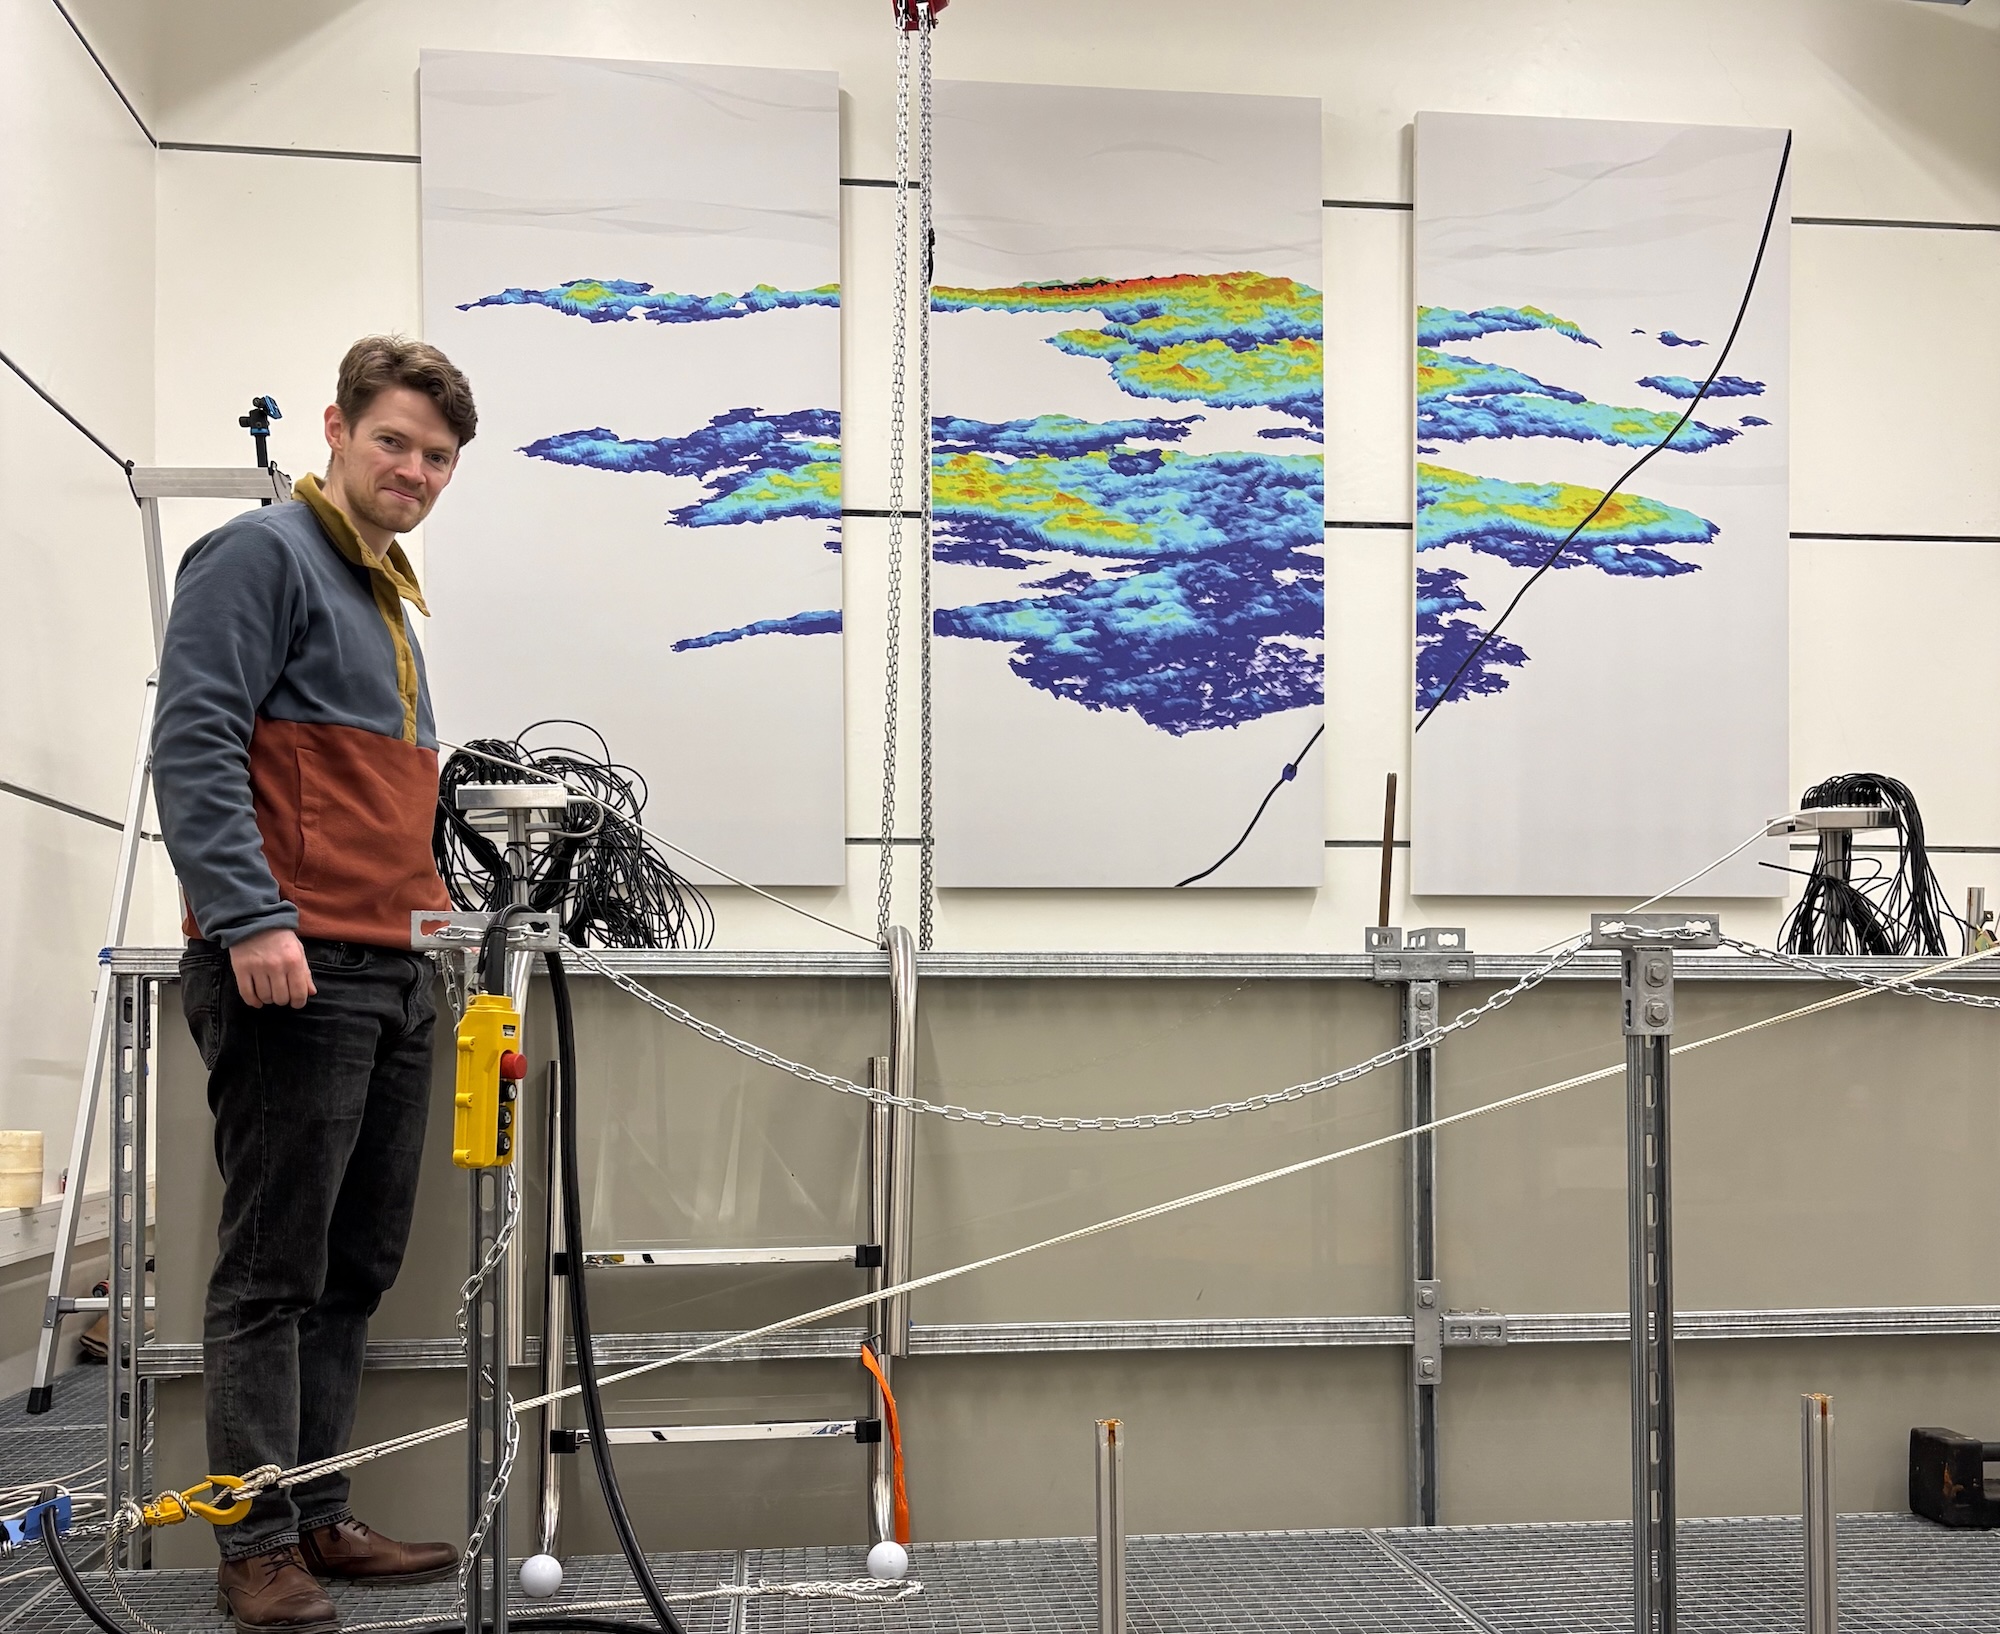
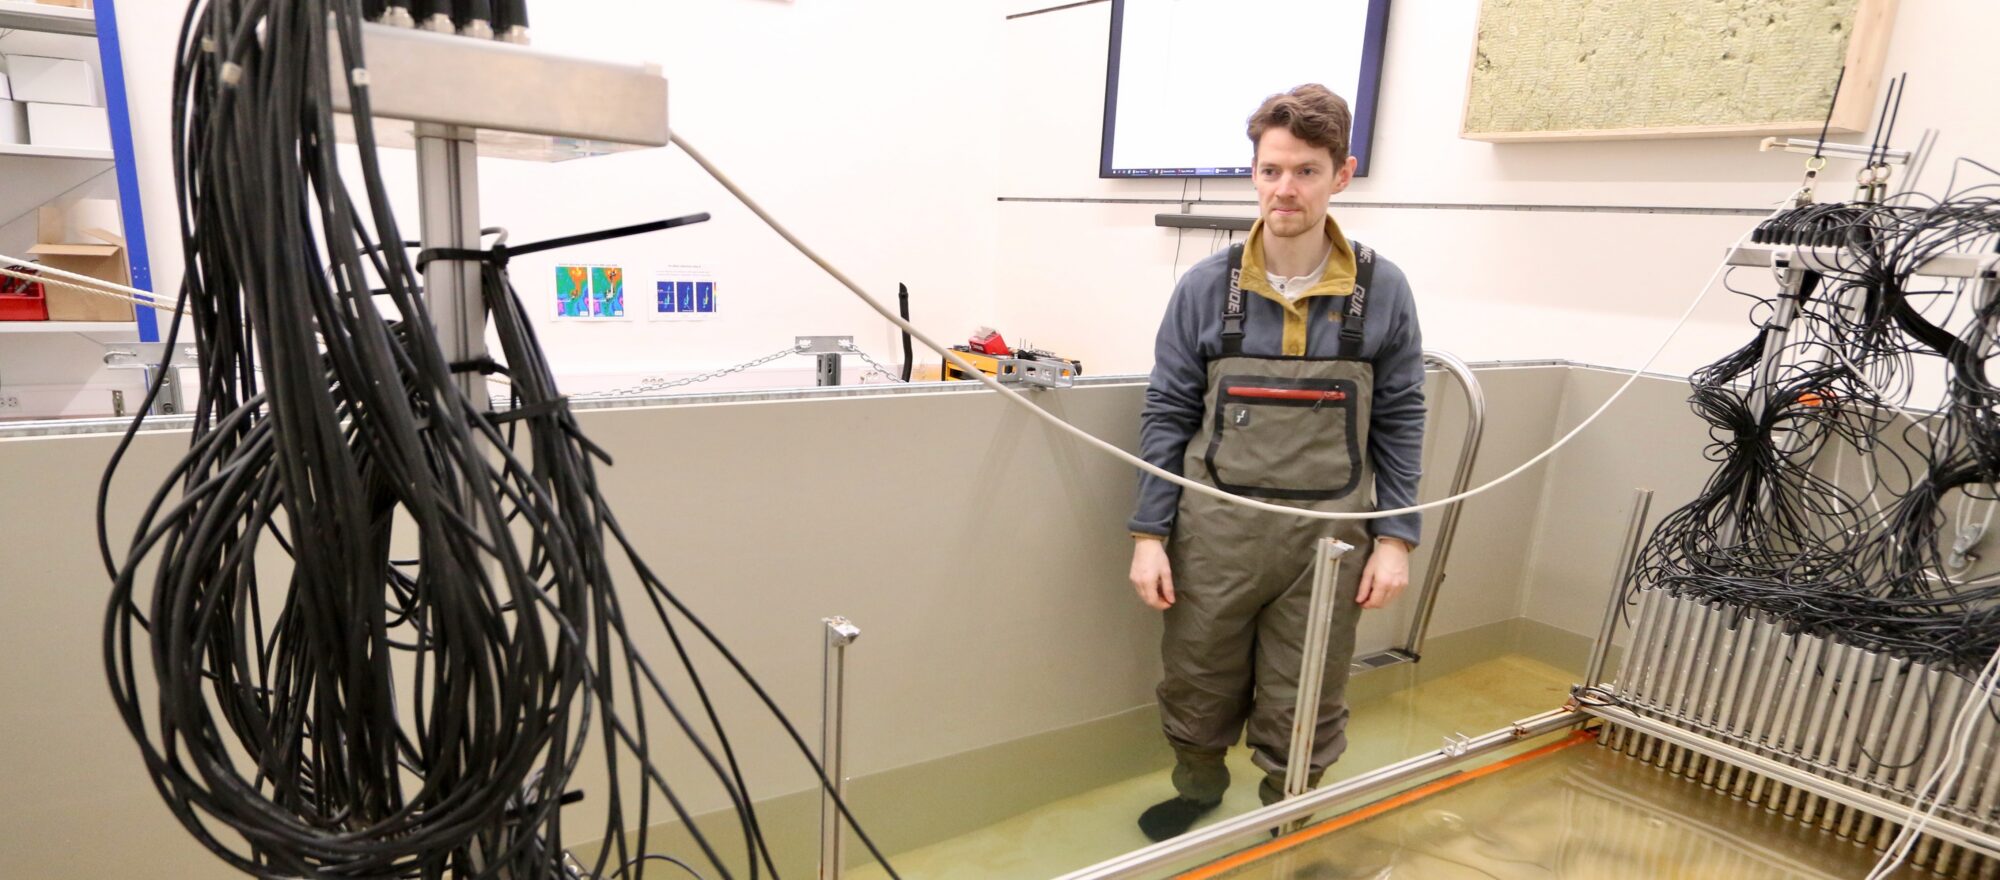
Kasper Hunnestad next to the tank he and colleagues use to study different monitoring approaches to the Sleipner field. Behind him is an image of the entire Utsira formation showing how the CO2 is distributed in the saline aquifer. Photo: Nancy Bazilchuk, NTNU
The new lab is centred around a 2-by-4 metre tank filled with water. Inside the tank is a several-hundred-kilo mockup of the top layer of the Utsira Formation. This is the cap rock that prevents the CO2 from leaking out of the formation
This laboratory and its big tank are the equivalent of a sandbox where CGF researchers can test different ways of measuring what’s happening in the Utsira mockup.
And because they have 30 years of data from Sleipner, they know how the CO2 has behaved in the past and can use that for comparisons and calibration.
- You might also like: The Longship that could help save the planet
Challenging the system to see what happens
Kasper Hunnestad, a CGF postdoc, is responsible for the lab. He’s spent hours and hours setting up the tank with its heavy plastic model.
What we can do is to challenge the system a bit. We know what works. But what happens if you take away some of the data?
On each end of the tank are movable racks with rows of aluminium tubes, about the diameter of a garden hose and topped by black wires. Each of the wires goes to a ultrasonic sender and receiver that he can use to scan the mockup as he changes the amount of air – his CO2 proxy – he’s injecting into the system.
The racks can be moved back and forth over the mockup at different speeds, mimicking how a conventional underwater seismic survey might be conducted.
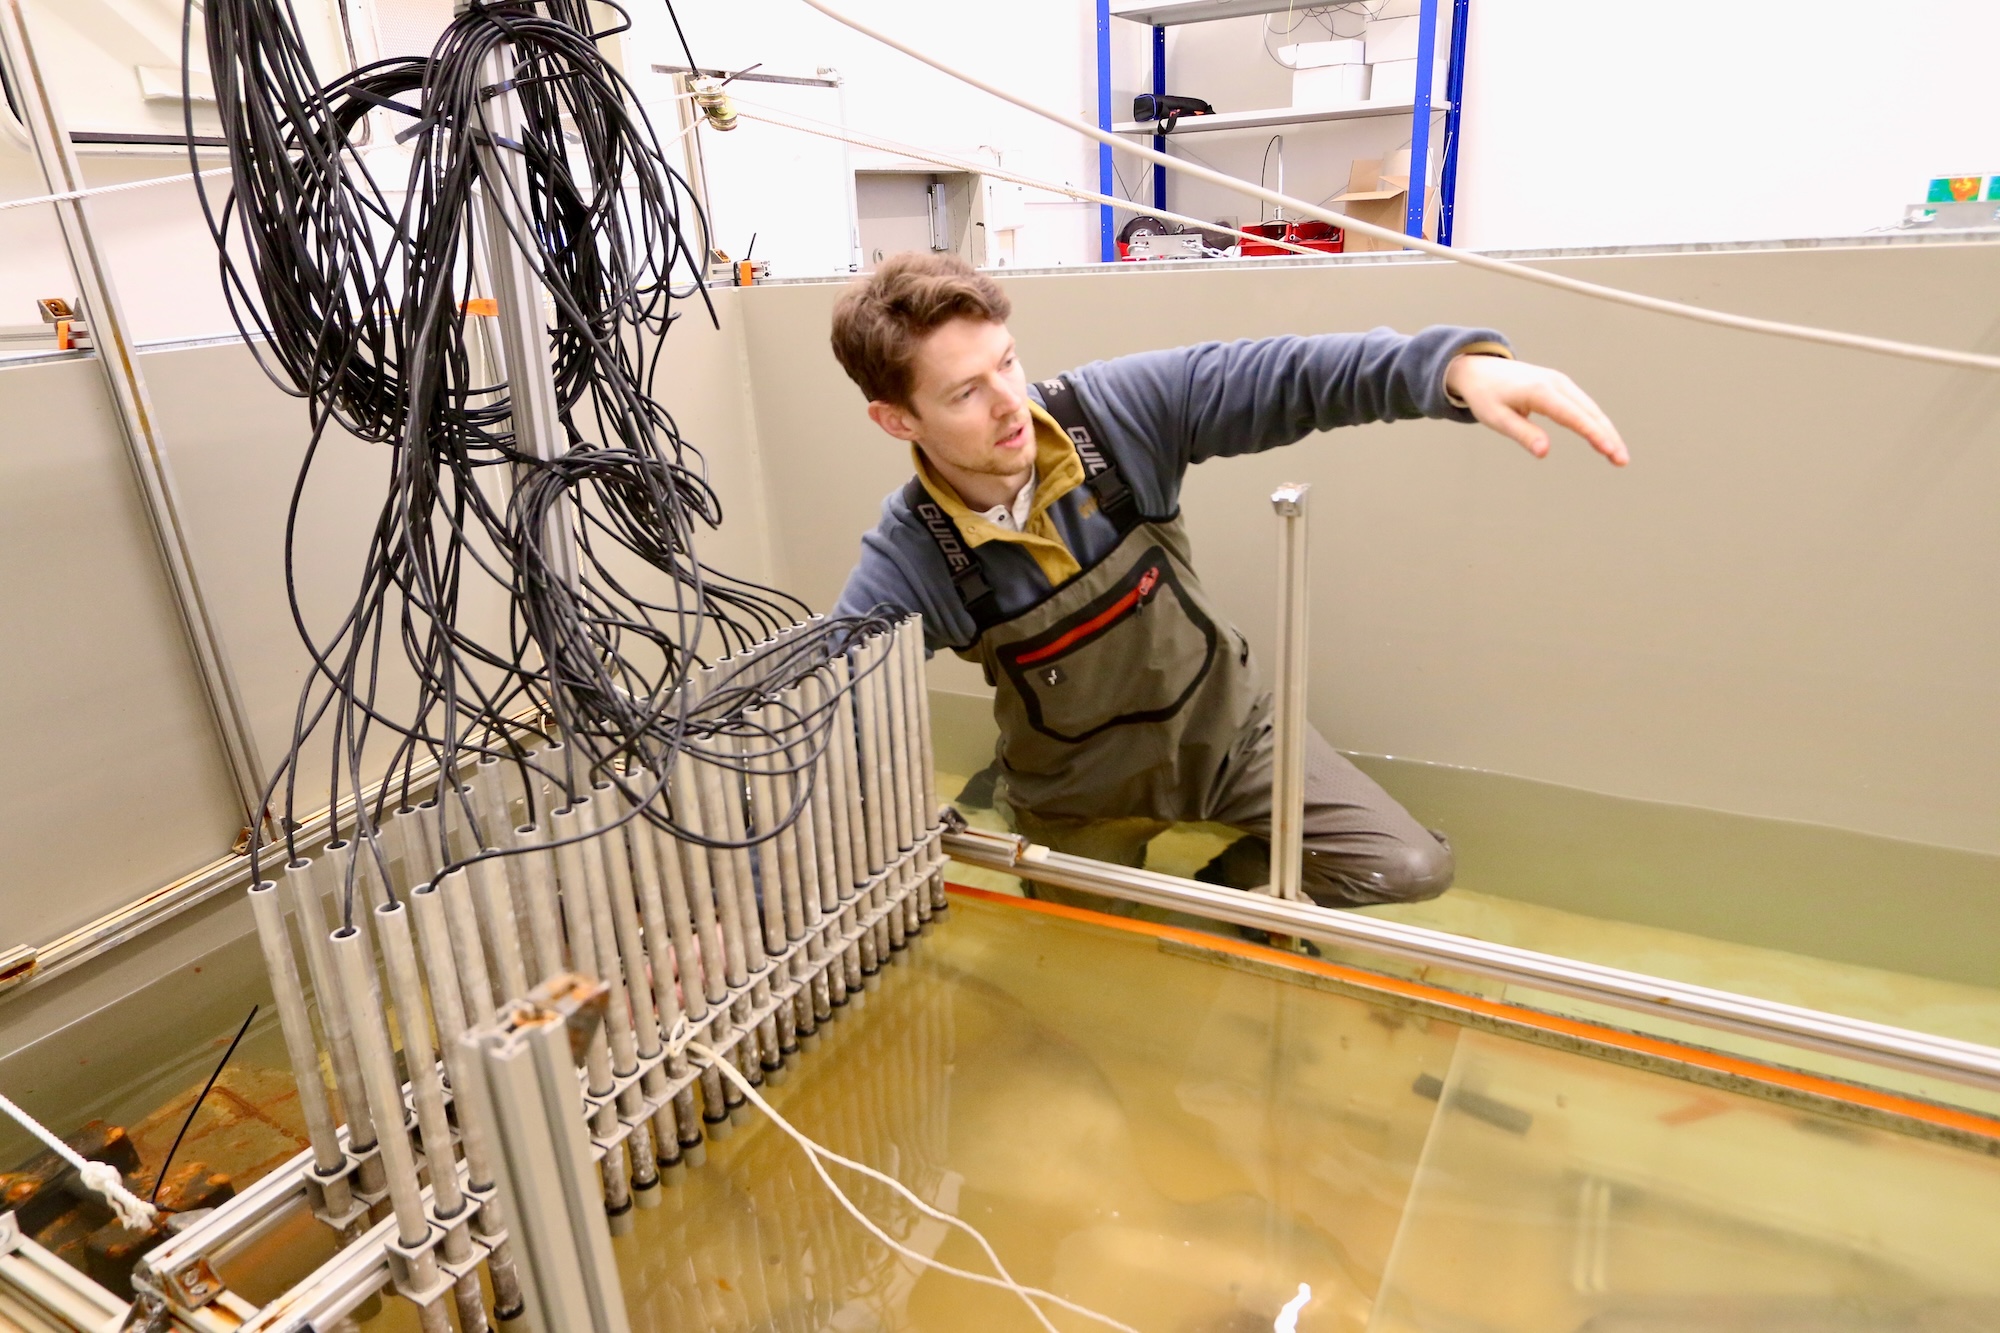
Kasper Hunnestad explains how he can move the racks with ultrasonic sensors over the mockup of the Utsira formation to simulate the way seismic surveys are conducted out in the ocean. The ultrasonic sensors are in the tall metal pipes to the left of the photo. Photo: Nancy Bazilchuk, NTNU
You can see the air bubbles in the translucent plastic of the model, but more importantly, the wild tangle of wires and sensor allows him to scan the model and show exactly what has happened to his CO2 proxy over time.
“Then if you have several of these scans, you can kind of set up a timeline image of how the air has been distributed around the tank, which is the CO2 monitoring part,” he said. “That’s actually what you would do in the field.”
But the beauty of the lab is that Hunnestad can change some of the features of the system to see what happens to the information he gets.
“What we can do is to challenge the system a bit. We know what works. But what happens if you take away some of the data? What if you don’t have the luxury of having all the data, can we still see how the CO2 is distributed?” he said.
The answers could help reduce the costs of monitoring CO2 storage sites – and could help improve their accuracy.
More about carbon capture and storage
Carbon capture and storage (CCS) is widely accepted as being critical in limiting the amount of the greenhouse gas CO2 released to the atmosphere. In its 2023 Synthesis Report, the Intergovernmental Panel on Climate Change, the IPCC, underscores the need for CCS in helping the world cut emissions.
So as the world scales up and commercializes the use of undersea storage areas like Sleipner, companies and government watchdogs need reliable and affordable ways to make sure these undersea storage areas are doing what they are supposed to do.
While many existing projects are land-based, there’s also significant capacity in deep saline formations and depleted oil and gas fields offshore.
That’s especially true for Europe, where the government of Norway in particular has supported the Longship project, the first project in the world to integrate the entire CCS chain – from capture to transport and storage.
Northern Lights, a partnership owned by Equinor, Shell and TotalEnergies, stored its first CO2 from the Heidelberg Material’s cement factory in Brevik in August 2025, and has contracts to store CO2 from companies in the Netherlands, Denmark, and Sweden.
Improving accuracy and looking ahead
CGF’s Ringrose says that CGF’s industrial partners are deeply interested in seeing results from the test laboratory.
“The competing geophysical companies who are our partners want to be in this space because they see a business opportunity. They want to be able to go to the operators and say, we can tell you where your CO2 is. It is definitely a competitive space,” he said.
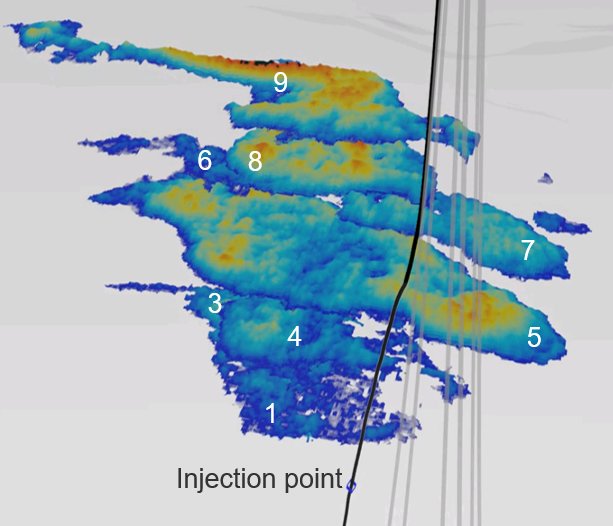
A 3D reconstruction of seismic imaging data at Sleipner which shows the distribution of the multi-layer CO2 plume in 2010, using a method developed by Kiær et al. 2016. The warmer the colour, the higher the concentration of CO2. Image courtesy of Equinor.
Centre director Landrø thinks the future may lie in using sensing technologies such as fibre optic cables. These are the glass fibre cables that are used carry information, such as the internet and communications information across the ocean.
In other CGF research, Landrø and his colleagues have been able to use fibre optic cables offshore of Svalbard to identify and track whales. So why not CO2?
“What we foresee in the future is that if you have a storage area like this, you deploy not conventional seismic cables, but fibre optic cables and you just plough them 10 or 20 centimetres below the seabed,” he said. “That will be a challenge to do in a quick and economic way, but the fibre doesn’t cost anything.”
References:
Ricardo Martinez, Vetle Vinje, Harrison Moore, Steve Hollingworth, Philip Ringrose, Alexey Stovas; Unraveling multi-layer CO2 plumes using the entire wavefield: Case study from the Sleipner storage site. Interpretation 2025; doi: https://doi.org/10.1190/int-2025-0016
Ringrose, P., Martinez, R., Vinje, V. and Mispel, J., 2024. Estimating the Multi-Scale Distribution of Co2 Using Seismic Data at Sleipner. International Journal of Greenhouse Gas Control, Volume 151, 104581 https://doi.org/10.1016/j.ijggc.2026.104581
Ringrose, P., 2023. Storage of Carbon Dioxide in Saline Aquifers: Building confidence by forecasting and monitoring. Society of Exploration Geophysicists.
https://doi.org/10.1190/1.9781560803959